| Table 1. Degraded area and population distribution in dryland zones. | ||||||
| Dryland zones | Size of the area (million km2)* | Share of global area (%)* | Degraded area (million km2)** | Degraded area (%) | Population*** | Population density (km2) |
| Dry sub-humid | 12.96 | 8.7 | 2.5 | 19.5 | 909 972 000 | 70 |
| Semi-arid | 22.67 | 15.2 | 4.8 | 21.2 | 855 333 000 | 38 |
| Arid | 15.17 | 10.6 | 4.5 | 28.7 | 242 780 000 | 16 |
| Total dryland | 50.80 | 34.5 | 11.8 | 23.1 | 2 008 085 000 | 40 |
| Sources: * UN 2011. Global drylands: a UN system-wide response. Environment Management Group. 132 p. http://www.unccd.int/Lists/SiteDocumentLibrary/Publications/Global-Drylands-ENG.pdf. ** Zika and Erb 2009. *** UNCCD 2011. Desertification: a visual synthesis. Bonn. 50 p. | ||||||
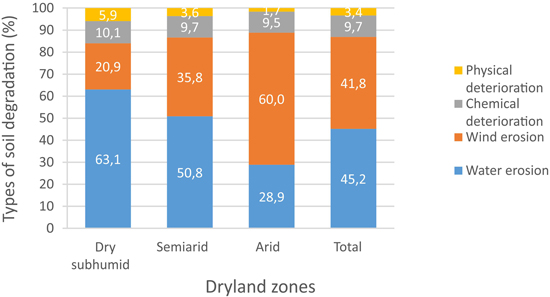
Fig. 1. Types of soil degradation (million km2) in dryland zones. (Data source: UNEP1997).
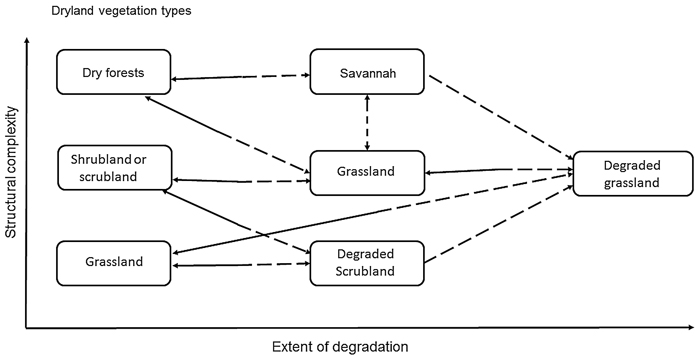
Fig. 2. The extent of dryland disturbance and consequently degradation affects vegetation structural complexity. Dryland vegetation succession (→) and regression (― →).