| Table 1. Measurements from SMEAR II station. The Manual selection indicates subjective pre-selection to the any time model by LARS (see 2.4.2). | |||||
| Manual selection | Variable | Abbreviation | Units | Specifications | Missing values |
| √ | Precipitation | Prec | mm | includes snow | 1% |
| √ | Air temperature | T | °C | – | |
| Atmospheric pressure | P | hPa | – | ||
| √ | Air relative humidity | RH | % | – | |
| CO2 concentration in air | CO2 | ppm | – | ||
| Water vapour in air | H2O | ppth | – | ||
| Soil volumetric water content | MO | m3 m–3 | O horizon | 50% | |
| √ | Soil volumetric water content | MA | m3 m–3 | A horizon | 50% |
| Soil volumetric water content | MB | m3 m–3 | B horizon | 50% | |
| Soil volumetric water content | MC | m3 m–3 | C horizon | 50% | |
| Soil temperature | TO | °C | O horizon | 1% | |
| Soil temperature | TA | °C | A horizon | 1% | |
| √ | Soil temperature | TB | °C | B horizon | 1% |
| Soil temperature | TC | °C | C horizon | 1% | |
| √ | Net ecosystem exchange | NEE | μmol m–2 s–2 | for CO2 | – |
| √ | Total ecosystem exchange | TER | μmol m–2 s–2 | for CO2 | – |
| √ | Gross primary production | GPP | μmol m–2 s–2 | for CO2 | – |
| √ | Evapotranspiration | ET | μmol m–2 s–2 | 1% | |
| Sensible heat flux | H | W m–2 | – | ||
| Vapour Pressure Deficit | VPD | kPa | – | ||
| √ | Global shortwave radiation | SW | W m–2 | 9% | |
| Reflected shortwave radiation | SWR | W m–2 | 10% | ||
| √ | Photosynthetically active radiation | PAR | μmol m–2 s–2 | 400–700 nm | – |
| Reflected PAR | PARR | μmol m–2 s–2 | 11% | ||
| Ultraviolet A | UVA | W m–2 | 320–400 nm | 6% | |
| Ultraviolet B | UVB | W m–2 | 280–320 nm | 7% | |
| √ | Snow depth | dsnow | cm | 3% | |
| √ | Snow presence | Snow | present/absent | 3% | |
| Wind speed | WS | m s–1 | – | ||
| wind direction E–W | WDEW | ° | cos of direction | 8% | |
| wind direction N–S | WDNS | ° | sine of direction | 8% | |
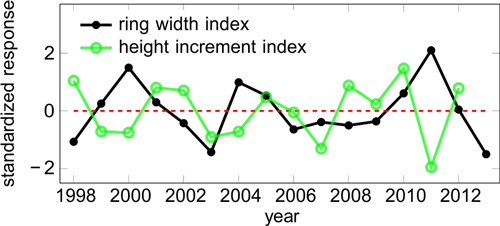
Fig. 1. Standardized response variables i.e. indices for ring width (RWI) and height increment (HII).
| Table 2a. Predictive accuracies of explanatory variables for the ring width indices. Cons. indicates the consistency index for the best time, R2 fit the coefficient of determination of the model fit on all data and R2 test the coefficient of determination of leave-one-out cross-validation testing. The abbreviations are introduced in Table 1. | ||||
| Feature | Best time | Cons. | R2 fit | R2 test |
| Prec. | Dec 4 – Dec 31 [y-1] | 1 | 0.44 | 0.35 |
| T | Jan 2 – Jan 29 [y-1] | 0.9 | 0.37 | –0.17 |
| P | Dec 4 – Dec 31 [y-1] | 0.9 | 0.3 | –0.91 |
| RH | May 22 – Jun 18 [y-1] | 0.4 | 0.22 | –2.23 |
| CO2 | Aug 13 – Sep 9 | 0.8 | 0.02 | –0.62 |
| H2O | Aug 14 – Sep 10 [y-1] | 0.8 | 0.3 | –0.48 |
| MO | Jul 3 – Jul 30 [y-1] | 0.8 | 0.14 | –0.73 |
| MA | May 22 – Jun 18 [y-1] | 0.8 | 0.12 | –0.56 |
| MB | May 22 – Jun 18 [y-1] | 0.9 | 0.23 | –0.13 |
| MC | May 22 – Jun 18 [y-1] | 0.9 | 0.26 | –0.04 |
| TO | Jul 2 – Jul 29 | 0.3 | 0.17 | –1.28 |
| TA | Jan 16 – Feb 12 [y-1] | 0.9 | 0.34 | –0.68 |
| TB | Jan 16 – Feb 12 [y-1] | 0.9 | 0.43 | –0.07 |
| TC | Jan 2 – Jan 29 [y-1] | 0.8 | 0.3 | –0.37 |
| NEE | Apr 9 – May 6 | 1 | 0.38 | 0.2 |
| TER | Aug 13 – Sep 9 | 0.6 | 0.25 | –0.98 |
| GPP | Apr 9 – May 6 | 1 | 0.42 | 0.26 |
| ET | Jan 2 – Jan 29 [y-1] | 0.6 | 0.12 | –1.45 |
| H | Jan 2 – Jan 29 [y-1] | 0.9 | 0.39 | –0.06 |
| VPD | May 22 – Jun 18 [y-1] | 0.4 | 0.16 | –1.23 |
| SW | Nov 20 – Dec 17 [y-1] | 0.6 | 0.3 | –1.33 |
| SWR | Apr 23 – May 20 | 1 | 0.4 | 0 |
| PAR | May 22 – Jun 18 [y-1] | 0.8 | 0.22 | –0.66 |
| PARR | Aug 28 – Sep 24 [y-1] | 0.8 | 0.26 | –0.96 |
| UVA | Nov 20 – Dec 17 [y-1] | 0.7 | 0.28 | –0.93 |
| UVB | Nov 20 – Dec 17 [y-1] | 0.4 | 0.26 | –1.31 |
| dsnow | Apr 24 – May 21 [y-1] | 0.8 | 0.24 | –5.28 |
| Snow | Apr 24 – May 21 [y-1] | 0.7 | 0.15 | –3.77 |
| WS | Apr 9 – May 6 | 0.6 | 0.2 | –1.29 |
| WDEW | Jun 5 – Jul 2 [y-1] | 0.9 | 0.18 | –1.74 |
| WDNS | Sep 25 – Oct 22 [y-1] | 0.9 | 0.09 | –1.22 |
| Table 2b. Predictive accuracies of explanatory variables for height growth indices. Columns as in Table 2a. | ||||
| Feature | Best time | Cons. | R2 fit | R2 test |
| Prec. | Jan 16 – Feb 12 [y-1] | 0.8 | 0.25 | –1.24 |
| T | Jul 3 – Jul 30 [y-1] | 0.4 | 0.26 | –2.19 |
| P | Feb 12 – Mar 11 | 0.4 | 0.32 | –0.66 |
| RH | Jun 4 – Jul 1 | 0.9 | 0.36 | –0.84 |
| CO2 | Aug 13 – Sep 9 | 0.5 | 0.01 | –0.92 |
| H2O | Apr 23 – May 20 | 0.9 | 0.3 | –0.82 |
| MO | Jun 4 – Jul 1 | 0.6 | 0.14 | –1.19 |
| MA | Jun 4 – Jul 1 | 0.3 | 0.12 | –1.32 |
| MB | May 8 – Jun 4 [y-1] | 0.4 | 0.17 | –1.15 |
| MC | May 22 – Jun 18 [y-1] | 0.8 | 0.13 | –1.2 |
| TO | Jan 16 – Feb 12 [y-1] | 0.9 | 0.29 | –0.84 |
| TA | Jan 2 – Jan 29 [y-1] | 0.8 | 0.25 | –1.21 |
| TB | Jan 2 – Jan 29 [y-1] | 0.9 | 0.22 | –0.62 |
| TC | Nov 20 – Dec 17 [y-1] | 0.3 | 0.08 | –1.2 |
| NEE | Jul 31 – Aug 27 [y-1] | 0.9 | 0.42 | 0.14 |
| TER | Mar 26 – Apr 22 | 0.6 | 0.29 | –0.83 |
| GPP | Jul 31 – Aug 27 [y–1] | 0.9 | 0.38 | –0.27 |
| ET | Jun 18 – Jul 15 | 0.8 | 0.22 | –0.71 |
| H | Jan 2 – Jan 29 [y-1] | 0.8 | 0.34 | –0.76 |
| VPD | Jun 4 – Jul 1 | 0.7 | 0.4 | –0.78 |
| SW | Jul 31 – Aug 27 [y-1] | 0.7 | 0.31 | –0.78 |
| SWR | Sep 25 – Oct 22 [y-1] | 0.6 | 0.31 | –1.59 |
| PAR | Jul 3 – Jul 30 [y-1] | 0.9 | 0.39 | –0.14 |
| PARR | Nov 20 – Dec 17 [y-1] | 0.9 | 0.46 | –0.09 |
| UVA | Jan 29 – Feb 25 | 0.9 | 0.43 | –0.79 |
| UVB | Apr 10 – May 7 [y-1] | 1 | 0.51 | 0.31 |
| dsnow | Nov 6 – Dec 3 [y-1] | 0.4 | 0.17 | –5.13 |
| Snow | Apr 9 – May 6 | 0.9 | 0.38 | –0.6 |
| WS | Mar 12 – Arp 8 | 0.6 | 0.21 | –1.02 |
| WDEW | Sep 25 – Oct 22 [y-1] | 0.8 | 0.29 | –0.2 |
| WDNS | Jun 19 – Jul 16 [y-1] | 0.9 | 0.28 | –0.34 |
| Table 3. Predictive accuracy of selected models with 1–4 predictors for the ring width and height growth indices by the greedy approach. The abbreviations are introduced in Table 1. The used periods are as in Table 2 a and b. | ||||||
| Predictor | R2 fit | R2 test | ||||
| 1 | 2 | 3 | 4 | |||
| Ring width | Prec. | MC | GPP | H | 0.81 | 0.52 |
| H2O | MC | TB | NEE | 0.92 | 0.48 | |
| Prec. | TB | TC | ET | 0.70 | 0.41 | |
| T | MB | MC | SWR | 0.75 | 0.38 | |
| H2O | H | SWR | - | 0.67 | 0.36 | |
| Prec. | NEE | - | - | 0.59 | 0.35 | |
| H2O | MB | TC | GPP | 0.28 | 0.84 | |
| MO | TB | SWR | - | 0.17 | 0.57 | |
| Height growth | PARR | UVB | dsnow | Snow | 0.81 | 0.63 |
| MA | GPP | H | UVB | 0.89 | 0.60 | |
| H2O | TB | NEE | PAR | 0.74 | 0.46 | |
| Prec. | RH | TER | UVB | 0.84 | 0.38 | |
| PAR | UVB | - | - | 0.63 | 0.33 | |
| H2O | GPP | SWR | PARR | 0.77 | 0.31 | |
| MB | TA | NEE | H | 0.17 | 0.79 | |
| NEE | PARR | WD | - | 0.15 | 0.64 | |
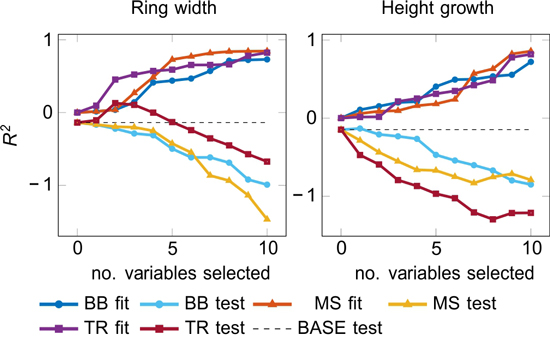
Fig. 3. Accuracy of fit and test models by LARS (see 2.4.2) as a function of the number of included variables.
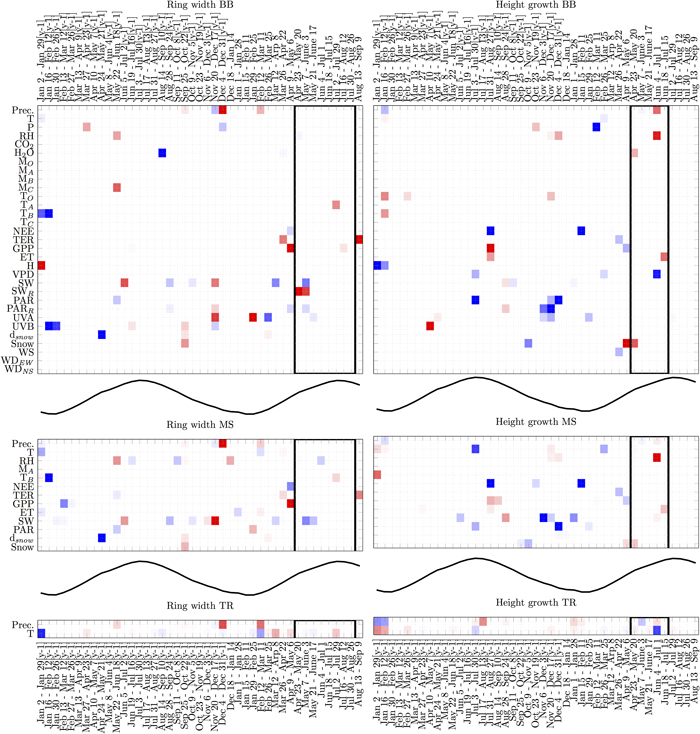
Fig. 4. Analysis of variable selection by LARS in three types of any-time models with different number of candidate predictors (BB, MS and TR). The vertical axis lists variables and the horizontal axis times of year. Black-lined rectangles indicate the most probable actual growing period (Schiestl-Aalto et al. 2015). For time reference, the mean temperature over time is plotted in the middle of the models. Each square is an average over 15–16 models obtained using leave-one-out cross-validation procedure. Blue squares indicate negative relations, and red squares indicate positive relations. Darker colours encode more stable (consistent) performance over multiple trials. Abbreviations are introduced in Table 1. View larger in new window/tab.