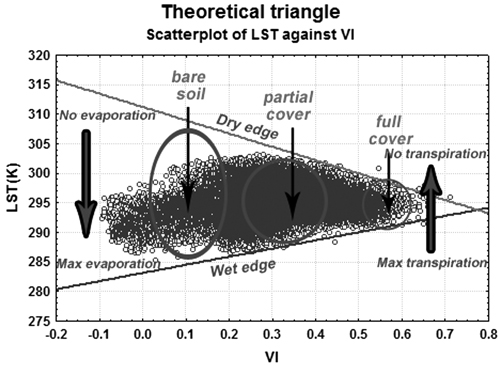
Fig. 1. Land surface temperature (LST) values plotted against a vegetation index (VI), forming a theoretical triangle model.
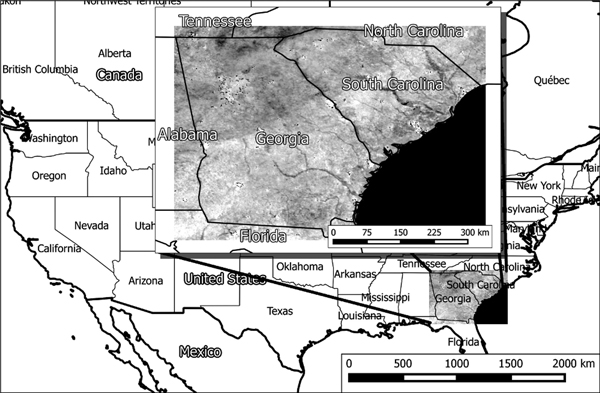
Fig. 2. The study area, located in the southeastern United States.
| Table 1. Beginning and ending times of data collection by MODIS satellite during each of the eleven 16-day periods considered in this study. | ||
| Period | Beginning date (time 00:00:00) | Ending date (time 23:59:59) |
| 1 | 22-Mar-2009 | 6-April-2009 |
| 2 | 7-April-2009 | 22-April-2009 |
| 3 | 23-April-2009 | 8-May-2009 |
| 4 | 9-May-2009 | 24-May-2009 |
| 5 | 25-May-2009 | 9-June-2009 |
| 6 | 10-June-2009 | 25-June-2009 |
| 7 | 26-June-2009 | 11-July-2009 |
| 8 | 12-July-2009 | 27-July-2009 |
| 9 | 28-July-2009 | 12-August-2009 |
| 10 | 13-August-2009 | 28-August-2009 |
| 11 | 29-August-2009 | 13-September-2009 |
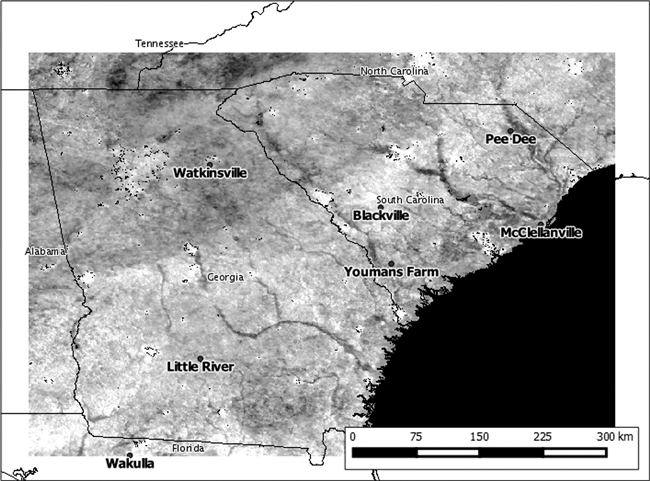
Fig. 3. Locations and names of the in situ moisture measurement stations in the study area.
| Table 2. Names of in situ moisture measurement stations, their networks, and geographic coordinates, for the analyzed data. | ||||
| Station number | Station name | Latitude, Longitude | Network | Vegetation type a |
| 1 | Little River | 31°30´N, 83°30´W | SCAN | Agriculture |
| 2 | Pee Dee | 34°18´N, 79°44´W | SCAN | Agriculture, young pine plantation, old deciduous forest |
| 3 | Wakulla | 30°18´N, 84°25´W | SCAN | Middle-aged pine plantation |
| 4 | Watkinsville | 33°53´N, 83°26´W | SCAN | Agriculture, developed areas |
| 5 | Youmans Farm | 32°40´N, 81°12´W | SCAN | Agriculture, old pine forest |
| 6 | Blackville | 33°21´N, 81°20´W | USCRN | Agriculture |
| 7 | McClellanville | 33°09´N, 79°22´W | USCRN | Agriculture, deciduous forest |
| a Vegetation types in the immediate area (100 m) around each measurement point. | ||||
| Table 3. Statistical summary of the in situ moisture data used for parameterization into moisture units (m3 m–3). | ||||||||
| Soil depth | Parameter | Little River | Pee Dee | Wakulla | Watkinsville | Youmans Farm | Blackville | McClellanville |
| cm | - | m3 m–3 | m3 m–3 | m3 m–3 | m3 m–3 | m3 m–3 | m3 m–3 | m3 m–3 |
| 5 | Minimum | 0.037 | 0.063 | 0.014 | 0.111 | 0.027 | 0.034 | 0.022 |
| Maximum | 0.338 | 0.296 | 0.140 | 0.405 | 0.327 | 0.213 | 0.110 | |
| Mean | 0.103 | 0.189 | 0.066 | 0.204 | 0.123 | 0.103 | 0.052 | |
| Std. Dev. | 0.038 | 0.055 | 0.029 | 0.069 | 0.058 | 0.055 | 0.017 | |
| 10 | Minimum | 0.047 | 0.051 | 0.029 | 0.054 | 0.038 | 0.047 | 0.019 |
| Maximum | 0.369 | 0.251 | 0.144 | 0.327 | 0.304 | 0.171 | 0.111 | |
| Mean | 0.102 | 0.162 | 0.077 | 0.121 | 0.142 | 0.089 | 0.063 | |
| Std. Dev. | 0.035 | 0.046 | 0.025 | 0.052 | 0.058 | 0.038 | 0.022 | |
| 20 | Minimum | 0.056 | 0.048 | 0.010 | 0.067 | 0.030 | 0.210 | 0.012 |
| Maximum | 0.229 | 0.209 | 0.103 | 0.331 | 0.288 | 0.290 | 0.133 | |
| Mean | 0.116 | 0.137 | 0.060 | 0.128 | 0.137 | 0.240 | 0.076 | |
| Std. Dev. | 0.036 | 0.039 | 0.022 | 0.054 | 0.061 | 0.025 | 0.028 | |
| Table 4. Parameters for dry and wet edges of the calculated “triangles” for each of the analyzed eleven 16-day periods. | ||||||||
| Period | TVDI(NDVI) | TVDI(EVI) | ||||||
| Wet edge | Dry edge | Wet edge | Dry edge | |||||
| amin | bmin | amax | bmax | amin | bmin | amax | bmax | |
| 1 | 264.0 | 33.0 | 315.2 | –19.2 | 279.0 | 19.1 | 310.0 | –19.0 |
| 2 | 273.0 | 20.5 | 318.0 | –23.0 | 283.1 | 13.8 | 311.2 | –22.5 |
| 3 | 272.8 | 24.6 | 338.0 | –40.0 | 284.0 | 16.3 | 325.0 | –34.0 |
| 4 | 278.0 | 10.0 | 337.2 | –38.0 | 282.0 | 8.0 | 324.8 | –32.0 |
| 5 | 267.0 | 26.0 | 340.6 | –39.0 | 280.6 | 16.0 | 324.0 | –28.0 |
| 6 | 289.8 | 3.0 | 330.8 | –25.5 | 291.4 | 1.9 | 333.0 | –38.0 |
| 7 | 297.0 | –7.4 | 351.2 | –49.0 | 286.2 | 6.0 | 340.0 | –49.0 |
| 8 | 268.2 | 22.6 | 341.2 | –40.0 | 267.4 | 30.8 | 326.0 | –29.5 |
| 9 | 253.8 | 42.0 | 343.0 | –42.5 | 260.0 | 42.0 | 323.4 | –26.8 |
| 10 | 237.0 | 59.0 | 340.0 | –41.0 | 246.0 | 62.0 | 320.0 | –22.4 |
| 11 | 247.0 | 44.0 | 346.0 | –47.0 | 249.1 | 60.5 | 313.0 | –12.0 |
| Average | 268.0 | 25.2 | 336.5 | –36.7 | 273.5 | 25.1 | 322.8 | –28.5 |
| amax, bmax = linear regression parameters for the dry edge amin, bmin = linear regression parameters for the wet edge TVDI – Temperature Vegetation Dryness Index NDVI – Normalized Difference Vegetation Index EVI – Enhanced Vegetation Index | ||||||||
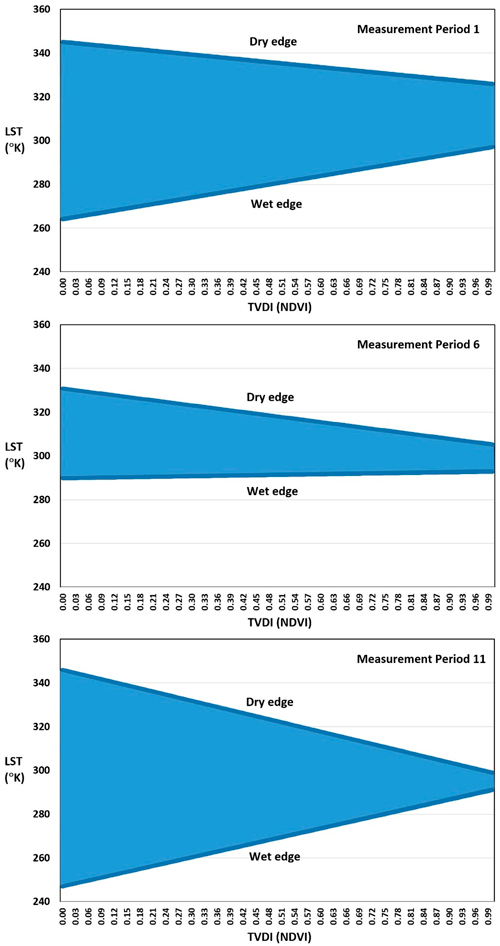
Fig. 4. Triangular relationships developed for the study area through the use of land surface temperature (LST) and Temperature Vegetation Dryness Index (TVDI) based on the Normalized Difference Vegetation Dryness index (NDVI).
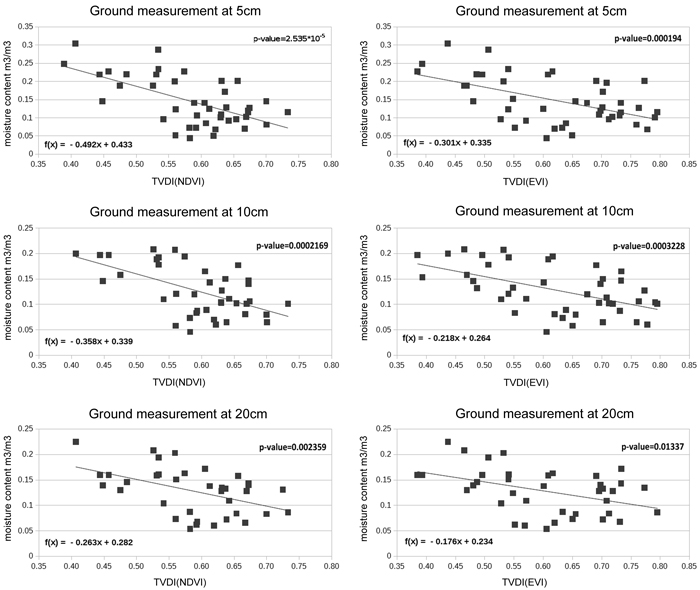
Fig. 5. Scatterplots with regression lines for in situ soil moisture content at three depths a) 5 cm; b) 10 cm; and c) 20 cm predicted from Temperature Vegetation Dryness Index (TVDI) values. P-values for each regression model are also shown. View larger in new window/tab.
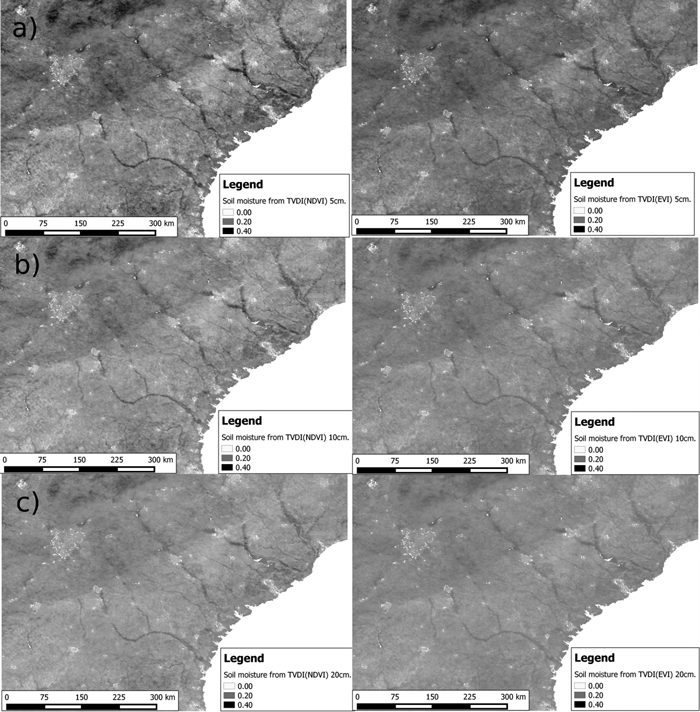
Fig. 6. Map of soil moisture values calculated from the MODIS based on Temperature Vegetation Dryness Index calculated using Normalized Difference Vegetation Index TVDI(NDVI) (left) and Temperature Vegetation Dryness Index calculated using Enhanced Vegetation Dryness Index TVDI(EVI) (right) for three depth measurements during the second study measurement period (April 7–22, 2009): a) 5 cm; b) 10 cm; and c) 20 cm. View larger in new window/tab.