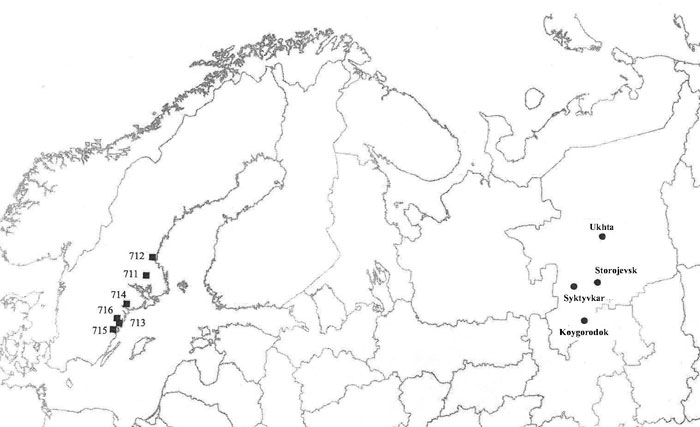
Fig. 1. Location of the lodgepole pine seed orchards and field trials.
| Table 1. Description of the field trials included in the study. | ||||||||
| Trial | Year of planting | Latitude, Longitude | Altitude (m a.s.l.) | Temperature suma | Spacing (m) | Total no. seedlings | No. blocks | Site type |
| Ukhta | 2004 | 63°40´N, 53°37´E | 140 | 863 | 2.5×2.0 | 3507 | 12 | Sand quarry |
| Storojevsk | 2004 | 61°53´N, 52°45´E | 104 | 1037 | 2.0×2.0 | 3865 | 11 | Farm sandy land |
| Koygorodok | 2004 | 60°22´N, 51°17´E | 167 | 1155 | 2.0×1.5 | 2363 | 10 | Sand quarry |
| Syktyvkar | 2006 | 61°40´N, 51°03´E | 132 | 1075 | 2.0×1.0 | 2374 | 6 | Forest sandy land |
| a Expected mean temperature sum in degree-days, threshold temperature +5 °C (Galenko 1999) | ||||||||
| Table 2. Identification of the lodgepole pine seed sourcesa (seedlings seed orchards) studied (after Ericsson 1994). | |||||||
| No. | Name | Site latitude | Year of establishment | Area, ha | Number of mother trees | Range of source tree origins in Canada | Range of proposed use in Sweden |
| 711 | Närlinge | 60°03´N | 1987 | 18.3 | 100 | 60°44’–63°40´N | 67° and north |
| 712 | Oppala | 60°46´N | 1983,–85 | 12.7 | 211 | 59°17’–62°40´N | 66°30’–67°00´N |
| 713 | Skörserum | 58°00´N | 1984,–85 | 18.2 | 210 | 57°36’–60°38´N | 66°00–66°30´N |
| 714 | Larslund | 58°46´N | 1982 | 15.1 | 178 | 55°38’–58°40´N | 64°30’–66°00´N |
| 715 | Rumhult | 57°41´N | 1981 | 21.7 | 218 | 54°17’–56°08´N | 62°30’–64°30´N |
| 716 | Österby | 58°08´N | 1981 | 14.3 | 300 | 50°51’–53°50´N | 60°30’–62°40´N |
| a In this study seed sources Närlinge, Oppala and Skörserum are considered as northern origins and Larslund, Rumhult and Österby as southern ones | |||||||
| Table 3. Analysis of variance of growth and quality traits of the all material studied. | ||||||||||
| Source | Growth traits | |||||||||
| Height, m | DBH, cm | Volume, dm3 | ||||||||
| df | MS | F-value | p-value | MS | F-value | p-value | MS | F-value | p-value | |
| Trial | 3 | 16.76 | 53.18 | <0.001 | 99.51 | 75.07 | <0.001 | 644.88 | 68.61 | <0.001 |
| Seed source (provenance) | 6 | 1.04 | 3.30 | 0.004 | 3.26 | 2.46 | 0.026 | 28.34 | 3.02 | 0.008 |
| Block | 10 | 1.20 | 3.82 | <0.001 | 5.65 | 4.27 | <0.001 | 29.92 | 3.18 | <0.001 |
| Error | 210 | 0.32 | - | - | 1.33 | 9.40 | ||||
| Quality traits | ||||||||||
| Stems with no defects | Stems with defects | Mortality | ||||||||
| df | MS | F-value | p-value | MS | F-value | p-value | MS | F-value | p-value | |
| Trial | 3 | 0.82 | 54.40 | <0.001 | 0.98 | 29.18 | <0.001 | 0.18 | 5.74 | <0.001 |
| Seed source (provenance) | 6 | 0.14 | 9.30 | <0.001 | 0.21 | 6.15 | <0.001 | 0.08 | 2.70 | 0.015 |
| Block | 10 | 0.02 | 1.15 | 0.327 | 0.10 | 3.11 | <0.001 | 0.02 | 0.56 | 0.842 |
| Error | 213 | 0.02 | 0.03 | 0.03 | ||||||
| Table 4. The mean values and standard errors of growth s and quality traits of all material studied. | |||||||||||
| Seed source (provenance) | Growth traits | ||||||||||
| Height, m | DBH, cm | Volume, dm3 | |||||||||
| Mean | SE | p-value | Mean | SE | p-value | Mean | SE | p-value | |||
| Närlinge | 3.38 | 0.15 | 0.250 | 5.2 | 0.33 | 0.500 | 7.5 | 0.88 | 0.453 | ||
| Oppala | 3.36 | 0.14 | 0.320 | 5.0 | 0.26 | 0.868 | 6.8 | 0.66 | 0.932 | ||
| Skörserum | 3.33 | 0.13 | 0.437 | 5.1 | 0.32 | 0.671 | 7.6 | 0.92 | 0.375 | ||
| Larslund | 3.12 | 0.15 | 0.988 | 4.9 | 0.33 | 0.973 | 6.8 | 0.82 | 0.910 | ||
| Rumhult | 3.15 | 0.13 | 0.979 | 4.8 | 0.28 | 0.997 | 6.5 | 0.72 | 0.984 | ||
| Österby | 2.96 | 0.13 | 0.999 | 4.4 | 0.30 | 0.998 | 5.1 | 0.71 | 0.994 | ||
| Standard | 3.00 | 0.11 | - | 4.6 | 0.26 | - | 5.8 | 0.60 | - | ||
| Quality traits | |||||||||||
| Stems with no defects | p-value | Stems with defects | p-value | Mortality | p-value | ||||||
| Närlinge | 0.22 | 0.03 | <0.001 | 0.43 | 0.04 | 0.226 | 0.30 | 0.03 | 0.999 | ||
| Oppala | 0.22 | 0.03 | <0.001 | 0.47 | 0.04 | 0.035 | 0.25 | 0.03 | 0.898 | ||
| Skörserum | 0.19 | 0.03 | <0.001 | 0.47 | 0.04 | 0.034 | 0.28 | 0.03 | 0.992 | ||
| Larslund | 0.23 | 0.04 | 0.003 | 0.55 | 0.04 | <0.001 | 0.23 | 0.02 | 0.688 | ||
| Rumhult | 0.17 | 0.04 | <0.001 | 0.54 | 0.04 | <0.001 | 0.32 | 0.03 | 0.999 | ||
| Österby | 0.20 | 0.04 | 0.002 | 0.48 | 0.05 | 0.026 | 0.38 | 0.04 | 0.883 | ||
| Standard | 0.38 | 0.04 | - | 0.31 | 0.03 | - | 0.31 | 0.03 | - | ||
| Table 5. The percentagea of trees with different types of defects for lodgepole pine seed sources and local Scots pine (standard). | |||||
| Seed source (provenance) | Forksb | Ramicornsb | Spike knotsc | Crookednessb | |
| weak | severe | ||||
| Närlinge | 27.7 | 18.7 | 12.0 | 40.8 | 0.8 |
| Oppala | 32.6 | 13.5 | 11.1 | 42.4 | 0.4 |
| Skörserum | 29.4 | 25.7 | 10.5 | 34.1 | 0.3 |
| Larslund | 27.3 | 32.6 | 4.4 | 34.8 | 0.9 |
| Rumhult | 21.7 | 39.4 | 10.4 | 28.5 | - |
| Österby | 23.2 | 41.5 | 7.3 | 27.7 | 0.3 |
| Standard | 13.0 | 30.5 | 22.0 | 33.9 | 0.6 |
| a the percentages were calculated as share of stems with defects b forks, ramicorns and crooked trees may have also spike knots c straight stems with spike knots | |||||
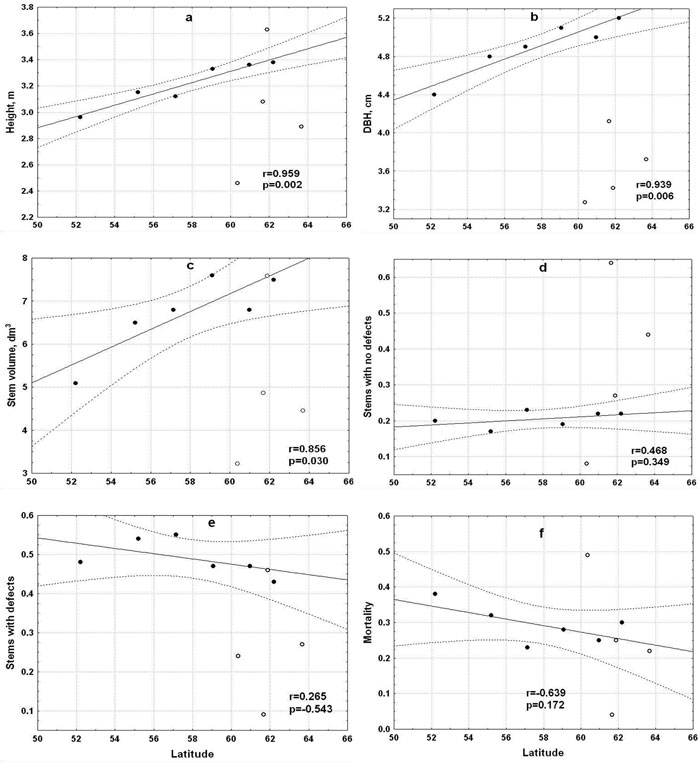
Fig. 2. Relationships between traits values (●) and average latitude of lodgepole pine material: a) height, b) diameter at breast height (DBH), c) volume, d) proportion of stems with no defects, e) proportion of stems with defects and f) mortality. Dotted lines represent 95% confidence intervals. Trait values of four standard Scots pine provenances (○). View larger in new window/tab