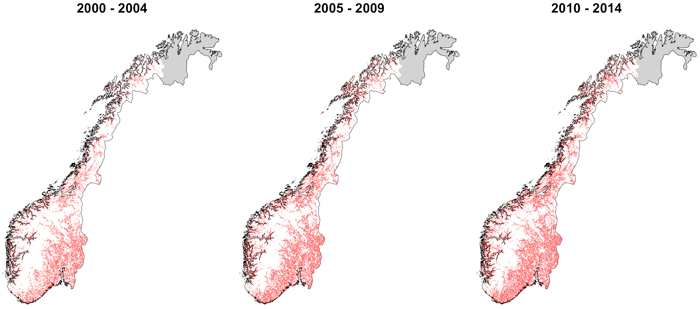
Fig. 1. Damaged plots by browsing during the period 2000–2014.
| Table 1. Summary of stand variables included in the analysis with an overview of their predicted effect on browsing damage occurrence. In brackets is the name of the variables used in the models and in square brackets the units when available or a C if the variable is categorical (details and description of the variables are provided in the Supplementary file 1). | |
| Variable | Predicted effect |
| Age (Age) [yr] | - |
| Development class (DevCl) [C] | - |
| Density (Density) [trees ha –1] | - |
| Diameter (Diam) [cm] | Not clear |
| Height (Height) [m] | Not clear |
| Basal area (BA) [m2 ha–1] | - |
| Stand size (StandSize) [C] | Not clear |
| Stand dominant specie (Spp) [C] | + mixed, pine |
| Percentage of spruce (PercSpr) [%] | - |
| Percentage of pine (PercPne) [%] | + |
| Percentage of birch (PercBrch) [%] | + |
| Percentage of conifer (PercOCo) [%] | Not clear |
| Percentage of deciduous (PercODec) [%] | + |
| Shannon index (Shannon) | + |
| Gini coefficient (Gini) | + |
| Structure (Structure) [C] | NA |
| Population on the stand edge (PopOnEdg) [C] | + No edge, agriculture, water and high |
| Stand edge distance (StandEdgeD) [m] | Not clear |
| Crown cover (CC) [%] | Not clear |
| Altitude (Altitude) [m] | + |
| Site index (SI) [C] | - |
| Previous treatment (PrevTr) | + No treatment, cutting of seed trees, thinning, tending, selective cutting and regeneration planting |
| Slope (Slope) [%] | - |
| Slope length (SlopeL) [m] | Not clear |
| Slope orientation (SlopeO) [C: N,S,W,E] | Not clear |
| Slope distance (SoilD) [m] | Not clear |
| Soil type (SoilT) [C] | Not clear |
| Steepness (Steepness) [%] | - |
| Relief (Relief) [C] | Not clear |
| The predicted effect is “+” when the variable increment means an increase in damage occurrence probability; “-” when the variable increment means a decrease in damage occurrence probability; “Not clear” when the trend is not clear; “NA” when the variable trend is not available. | |
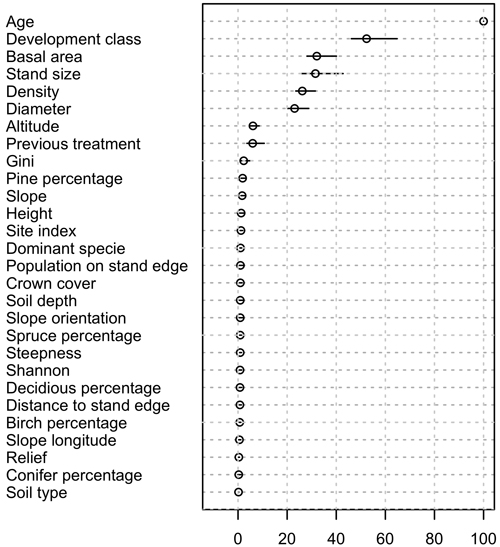
Fig. 2. Mean estimated variable importance in all 50 models and variability associated. The value 100 corresponds to the most important variable, and the rest are presented in relation to this score. Bars relate to the variability of the values. For all models, age had systematically the highest importance score.
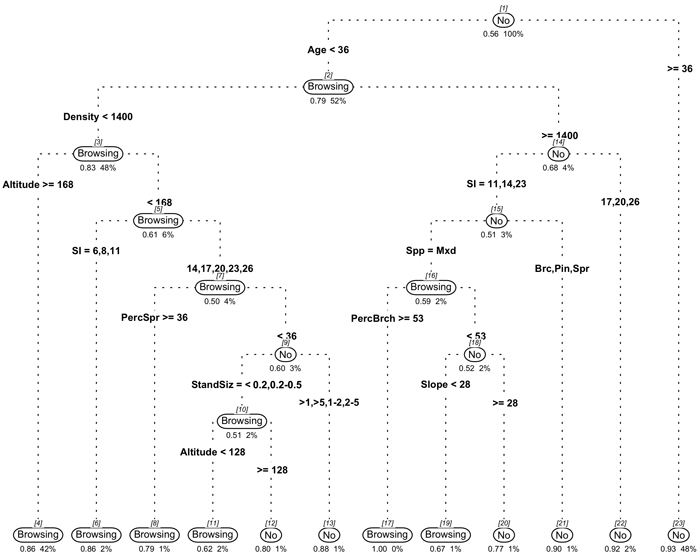
Fig. 3. Classification tree model predicting browsing damage occurrence. Square brackets indicate the node number; No or Browsing indicate the fitted class of non-damage plots and damaged plots, respectively. Below each fitted class it appears the probability of that class and the percentage of the total data present in that node. View larger in new window/tab