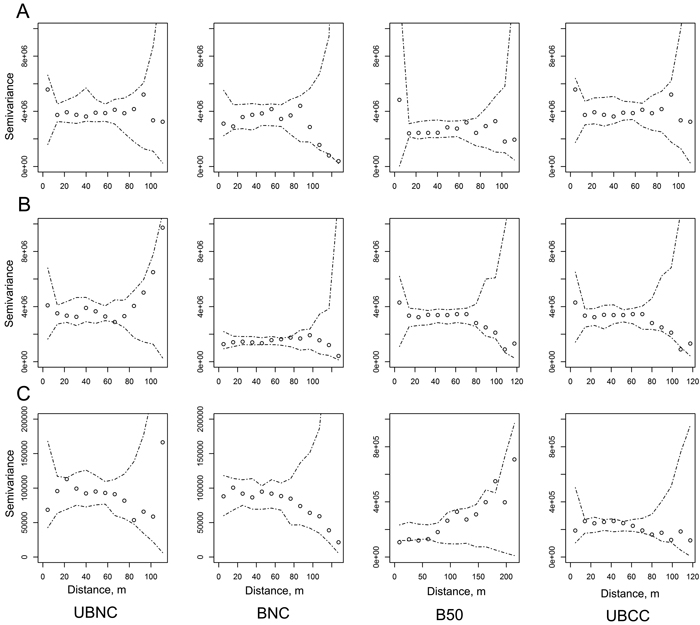
Fig. 1. Sample variograms with no-correlation confidence envelopes for organic hemic and sapric, i.e. Oe/Oa horizon (humus layer) soil organic matter (SOM) stocks (g m–2, A), uppermost 10 cm mineral SOM stocks (g m–2, B), and ground and field-layer vegetation biomass (g m–2, C) in the four sites (UBNC – unburned fully-stocked site (control); BNC – restoration-burned fully-stocked site; B50 – silviculturally-burned clearcut site with 50 m3 ha–1 green tree retention; UBCC – unburned complete clearcut site with no green tree retention). View larger in new window/tab.
| Table 1. Soil characteristics of the study sites. UBNC – fully-stocked uncut control site; BNC – fully-stocked burned site; B50 – burned clearcut site with 50 m3 ha–1 green tree retention; UBCC – unburned complete clearcut site with no retention. | |||||||||
| Parameter | Site | N obs. | Mean | Median | Variance | Stdev | CV, % | CV max/min | Rank Levene’s p |
| Organic hemic and sapric, i.e. Oe/Oa (humus layer) thickness, cm | UBNC | 80 | 5.0 | 5.0 | 3.0 | 1.7 | 35 | 1.64 | 0.742 |
| BNC | 83 | 4.0 | 3.8 | 2.7 | 1.6 | 41 | |||
| B50 | 75 | 2.6 | 2.4 | 2.1 | 1.5 | 57 | |||
| UBCC | 78 | 3.8 | 3.8 | 2.7 | 1.6 | 42 | |||
| Humus layer soil organic matter (SOM), % | UBNC | 80 | 86.5 | 92.0 | 173.1 | 13.2 | 15 | 1.84 | 0.142 |
| BNC | 83 | 77.2 | 83.2 | 340.2 | 18.4 | 24 | |||
| B50 | 76 | 71.3 | 76.4 | 398.0 | 19.9 | 28 | |||
| UBCC | 78 | 78.3 | 82.8 | 210.6 | 14.5 | 19 | |||
| Humus layer SOM, g m–2 | UBNC | 80 | 4470 | 4263 | 3 923 133 | 1981 | 44 | 1.61 | 0.361 |
| BNC | 83 | 3973 | 3586 | 3 554 194 | 1885 | 47 | |||
| B50 | 76 | 2272 | 1992 | 2 635 392 | 1623 | 71 | |||
| UBCC | 78 | 3763 | 3859 | 3 720 962 | 1929 | 51 | |||
| Uppermost 10 cm mineral SOM, % | UBNC | 80 | 4.88 | 4.34 | 6.52 | 2.55 | 52 | 2.18 | 0.041* |
| BNC | 80 | 4.07 | 4.15 | 1.19 | 1.09 | 27 | |||
| B50 | 75 | 4.88 | 4.60 | 5.46 | 2.34 | 48 | |||
| UBCC | 77 | 4.20 | 3.64 | 6.06 | 2.46 | 59 | |||
| Uppermost 10 cm mineral SOM, g m–2 | UBNC | 80 | 3550 | 3340 | 3 547 985 | 1884 | 53 | 2.09 | 0.222 |
| BNC | 81 | 4427 | 4477 | 1 260 189 | 1123 | 25 | |||
| B50 | 75 | 4056 | 3760 | 3 452 721 | 1858 | 46 | |||
| UBCC | 77 | 3780 | 3614 | 3 123 512 | 1767 | 47 | |||
| Forest floor (litter+humus) mass, g m–2 | UBNC | 80 | 5825 | 5596 | 6 928 280 | 2632 | 45 | 1.46 | 0.372 |
| BNC | 83 | 6336 | 5200 | 17 496 834 | 4183 | 66 | |||
| B50 | 76 | 3275 | 3078 | 3 699 799 | 1923 | 59 | |||
| UBCC | 78 | 5485 | 5120 | 11 442 338 | 3383 | 62 | |||
| Humus layer pH | UBNC | 7 | 3.76 | 3.88 | 0.0262 | 0.1618 | 4 | 3.19 | 0.011* |
| BNC | 8 | 3.91 | 3.81 | 0.1484 | 0.3852 | 10 | |||
| B50 | 8 | 4.34 | 4.30 | 0.0317 | 0.178 | 4 | |||
| UBCC | 8 | 4.03 | 4.06 | 0.0155 | 0.1246 | 3 | |||
| Uppermost 10 cm mineral soil pH | UBNC | 7 | 4.36 | 4.28 | 0.0318 | 0.1784 | 4 | 1.52 | 0.4 |
| BNC | 8 | 4.61 | 4.61 | 0.0361 | 0.1901 | 4 | |||
| B50 | 7 | 4.71 | 4.72 | 0.0859 | 0.293 | 6 | |||
| UBCC | 8 | 4.44 | 4.49 | 0.0613 | 0.2476 | 6 | |||
| N. obs. – total number of observations; Stdev – sample standard deviation; CV, % – coefficient of variation; CV max/min – ratio of the highest and lowest site-level CV for the parameter; Rank Levene’s p – p-value of the rank Levene’s test of equality of variance between sites, significance levels: * – p < 0.05. | |||||||||
| Table 2. Biomass of vegetation components in the study sites, g m–2. UBNC – fully-stocked uncut control site; BNC – fully-stocked burned site; B50 – burned clearcut site with 50 m3 ha–1 green tree retention; UBCC – unburned complete clearcut site with no retention. | ||||||||||
| Vegetation group | Site | N obs. > 0 | N obs. tot. | Mean | Median | Variance | Stdev | CV, % | CV max/min | Rank Levene’s p |
| Vaccinium myrtillus | UBNC | 77 | 80 | 103.9 | 97.8 | 6264.9 | 79.2 | 76 | 2.51 | < 0.001*** |
| BNC | 59 | 83 | 45.7 | 22.1 | 2863.2 | 53.5 | 117 | |||
| B50 | 52 | 76 | 15.7 | 4.3 | 619.1 | 24.9 | 159 | |||
| UBCC | 32 | 78 | 3.2 | 0.0 | 37.4 | 6.1 | 191 | |||
| Other dwarf shrubs | UBNC | 70 | 80 | 42.2 | 27.0 | 2264.7 | 47.6 | 113 | 1.41 | 0.025* |
| BNC | 68 | 83 | 63.6 | 43.8 | 3681.7 | 60.7 | 95 | |||
| B50 | 76 | 76 | 68.6 | 43.6 | 7135.2 | 84.5 | 123 | |||
| UBCC | 71 | 78 | 75.7 | 39.9 | 10 319.1 | 101.6 | 134 | |||
| Dead V. myrtillus | UBNC | 52 | 80 | 10.2 | 4.3 | 223.2 | 14.9 | 146 | 3.49 | < 0.001*** |
| BNC | 23 | 83 | 5.0 | 0.0 | 113.0 | 10.6 | 214 | |||
| B50 | 30 | 76 | 2.6 | 0.0 | 39.9 | 6.3 | 242 | |||
| UBCC | 6 | 78 | 0.2 | 0.0 | 1.3 | 1.1 | 509 | |||
| Litter | UBNC | 78 | 80 | 483.0 | 423.5 | 101 722.2 | 318.9 | 66 | 2.25 | 0.041* |
| BNC | 82 | 83 | 608.0 | 497.1 | 138 174.5 | 371.7 | 61 | |||
| B50 | 76 | 76 | 205.4 | 146.3 | 80 010.7 | 282.9 | 138 | |||
| UBCC | 77 | 78 | 395.8 | 233.9 | 224 122.4 | 473.4 | 120 | |||
| Moss | UBNC | 78 | 80 | 288.2 | 247.8 | 32 917.0 | 181.4 | 63 | 2.06 | 0.029* |
| BNC | 81 | 83 | 231.7 | 218.3 | 35 930.9 | 189.6 | 82 | |||
| B50 | 62 | 76 | 91.4 | 37.7 | 14 063.9 | 118.6 | 130 | |||
| UBCC | 75 | 78 | 357.8 | 289.3 | 97 570.1 | 312.4 | 87 | |||
| Lichen | UBNC | 4 | 80 | 3.9 | 0.0 | 1008.7 | 31.8 | 808 | 7.00 | < 0.001*** |
| BNC | 46 | 83 | 9.1 | 0.7 | 325.6 | 18.0 | 198 | |||
| B50 | 68 | 76 | 26.4 | 15.6 | 925.6 | 30.4 | 115 | |||
| UBCC | 41 | 78 | 105.1 | 0.0 | 48 228.7 | 219.6 | 209 | |||
| Forb | UBNC | 13 | 80 | 0.5 | 0.0 | 3.4 | 1.8 | 359 | 1.51 | < 0.001*** |
| BNC | 0 | 83 | 0.0 | 0.0 | 0.0 | 0.0 | - | |||
| B50 | 25 | 76 | 4.2 | 0.0 | 98.2 | 9.9 | 239 | |||
| UBCC | 21 | 78 | 3.4 | 0.0 | 89.3 | 9.4 | 275 | |||
| Graminoid | UBNC | 12 | 80 | 0.5 | 0.0 | 3.3 | 1.8 | 356 | 2.78 | 0.011* |
| BNC | 8 | 82 | 2.8 | 0.0 | 159.4 | 12.6 | 459 | |||
| B50 | 48 | 76 | 25.6 | 0.3 | 3049.2 | 55.2 | 216 | |||
| UBCC | 42 | 78 | 42.4 | 0.0 | 4907.5 | 70.1 | 165 | |||
| Seedling | UBNC | 2 | 80 | 0.313 | 0.000 | 8.146 | 2.854 | 911 | 2.54 | 0.019* |
| BNC | 16 | 83 | 0.494 | 0.000 | 3.154 | 1.776 | 359 | |||
| B50 | 5 | 76 | 0.341 | 0.000 | 5.998 | 2.449 | 718 | |||
| UBCC | 2 | 78 | 0.012 | 0.000 | 0.013 | 0.112 | 911 | |||
| N. obs. > 0 – number of observations with value greater than zero; N. obs. tot. – total number of observations; Stdev – sample standard deviation; CV, % – coefficient of variation; CV max/min – ratio of the highest and lowest site-level CV for the parameter; Rank Levene’s p – p-value of the rank Levene’s test of equality of variance between sites, significance levels: * – p < 0.05, ** – p < 0.01, *** – p < 0.001. | ||||||||||
| Table 3. Coverage of vegetation components in study sites, %. UBNC – fully-stocked uncut control site; BNC – fully-stocked burned site; B50 – burned clearcut site with 50 m3 ha–1 green tree retention; UBCC – unburned complete clearcut site with no retention. | ||||||||||
| Vegetation group | Site | N obs. > 0 | N obs. tot | Mean | Median | Variance | Stdev | CV, % | CV max/min | Rank Levene’s p |
| Vaccinium myrtillus | UBNC | 79 | 80 | 34.2 | 30.0 | 553.4 | 23.5 | 69 | 2.14 | < 0.001*** |
| BNC | 59 | 83 | 14.0 | 6.0 | 251.5 | 15.9 | 113 | |||
| B50 | 53 | 76 | 4.2 | 2.5 | 32.5 | 5.7 | 137 | |||
| UBCC | 39 | 78 | 1.1 | 0.0 | 2.6 | 1.6 | 147 | |||
| Vaccinium vitis-idaea | UBNC | 71 | 80 | 6.2 | 5.0 | 41.1 | 6.4 | 103 | 1.24 | 0.334 |
| BNC | 68 | 83 | 14.7 | 12.0 | 190.0 | 13.8 | 94 | |||
| B50 | 76 | 76 | 16.4 | 8.0 | 315.5 | 17.8 | 108 | |||
| UBCC | 73 | 78 | 10.7 | 6.0 | 153.6 | 12.4 | 116 | |||
| Pleurozium schreberi | UBNC | 70 | 80 | 30.6 | 20.0 | 845.0 | 29.1 | 95 | 5.91 | < 0.001*** |
| BNC | 64 | 83 | 17.8 | 5.0 | 609.0 | 24.7 | 139 | |||
| B50 | 8 | 76 | 1.8 | 0.0 | 107.2 | 10.4 | 562 | |||
| UBCC | 65 | 78 | 28.9 | 20.0 | 930.7 | 30.5 | 106 | |||
| Hylocomium splendens | UBNC | 48 | 80 | 25.2 | 7.0 | 947.2 | 30.8 | 122 | 5.16 | < 0.001*** |
| BNC | 11 | 83 | 0.8 | 0.0 | 12.9 | 3.6 | 426 | |||
| B50 | 2 | 76 | 0.1 | 0.0 | 0.4 | 0.7 | 632 | |||
| UBCC | 4 | 78 | 0.3 | 0.0 | 2.2 | 1.5 | 501 | |||
| Polytrichum spp. | UBNC | 6 | 80 | 0.2 | 0.0 | 1.3 | 1.1 | 496 | 3.88 | < 0.001*** |
| BNC | 36 | 83 | 3.5 | 0.0 | 60.0 | 7.7 | 219 | |||
| B50 | 59 | 76 | 21.5 | 5.5 | 753.4 | 27.4 | 128 | |||
| UBCC | 9 | 78 | 0.8 | 0.0 | 10.6 | 3.3 | 410 | |||
| Dicranum spp. | UBNC | 53 | 80 | 11.8 | 6.5 | 262.9 | 16.2 | 138 | 2.83 | 0.162 |
| BNC | 74 | 83 | 15.6 | 8.0 | 320.9 | 17.9 | 115 | |||
| B50 | 19 | 76 | 3.7 | 0.0 | 145.9 | 12.1 | 324 | |||
| UBCC | 51 | 78 | 6.8 | 3.0 | 96.2 | 9.8 | 145 | |||
| Calluna vulgaris | UBNC | 21 | 80 | 1.8 | 0.0 | 23.8 | 4.9 | 277 | 3.15 | < 0.001*** |
| BNC | 2 | 83 | 0.3 | 0.0 | 7.6 | 2.8 | 818 | |||
| B50 | 1 | 76 | 0.3 | 0.0 | 5.3 | 2.3 | 872 | |||
| UBCC | 2 | 78 | 1.1 | 0.0 | 45.9 | 6.8 | 622 | |||
| Epilobium angustifolium | UBNC | 0 | 80 | 0.0 | 0.0 | 0.0 | 0.0 | - | 1.18 | < 0.001*** |
| BNC | 0 | 83 | 0.0 | 0.0 | 0.0 | 0.0 | - | |||
| B50 | 27 | 76 | 1.9 | 0.0 | 19.2 | 4.4 | 227 | |||
| UBCC | 23 | 78 | 1.7 | 0.0 | 21.3 | 4.6 | 269 | |||
| Calamagrostis spp. | UBNC | 0 | 80 | 0.0 | 0.0 | 0.0 | 0.0 | - | 1.90 | < 0.001*** |
| BNC | 1 | 82 | 0.0 | 0.0 | 0.0 | 0.2 | 906 | |||
| B50 | 17 | 76 | 1.9 | 0.0 | 79.2 | 8.9 | 476 | |||
| UBCC | 3 | 78 | 0.2 | 0.0 | 1.6 | 1.3 | 585 | |||
| Deschampsia flexuosa | UBNC | 9 | 80 | 0.2 | 0.0 | 0.3 | 0.5 | 309 | 3.84 | 0.027* |
| BNC | 8 | 83 | 1.8 | 0.0 | 116.3 | 10.8 | 597 | |||
| B50 | 31 | 76 | 5.5 | 0.0 | 159.4 | 12.6 | 229 | |||
| UBCC | 41 | 78 | 17.3 | 1.3 | 718.1 | 26.8 | 155 | |||
| Cladonia spp. | UBNC | 3 | 80 | 0.7 | 0.0 | 31.3 | 5.6 | 841 | 8.01 | < 0.001*** |
| BNC | 58 | 83 | 1.7 | 0.3 | 12.0 | 3.5 | 198 | |||
| B50 | 79 | 88 | 7.3 | 5.6 | 58.9 | 7.7 | 105 | |||
| UBCC | 49 | 78 | 12.0 | 1.0 | 486.6 | 22.1 | 184 | |||
| N. obs. > 0 – number of observations with value greater than zero; N. obs. tot. – total number of observations; Stdev – sample standard deviation; CV, % – coefficient of variation; CV max/min – ratio of the highest and lowest site-level CV for the parameter; Rank Levene’s p – p-value of the rank Levene’s test of equality of variance between sites, significance levels: * – p < 0.05, ** – p < 0.01, *** – p < 0.001. | ||||||||||
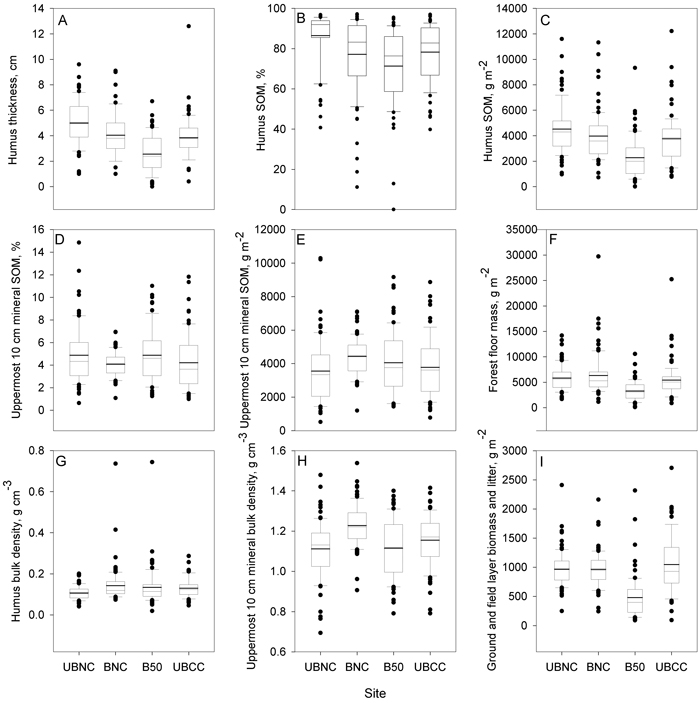
Fig. 2. Boxplots for soil parameter distributions within the study sites: A – organic hemic and sapric, i.e. Oe/Oa layer (humus layer) thickness; B – humus layer soil organic matter (SOM) concentration, mass %; C – humus layer SOM stocks, g m–2; D – uppermost 10 cm mineral SOM concentration, mass %; E – uppermost 10 cm mineral SOM stocks, g m–2; F – forest floor (whole O horizon) mass, g m–2; G – humus layer bulk density, g cm–3; H – uppermost 10 cm mineral soil bulk density, g cm–3; I – ground and field layer biomass and litter, g m–2. UBNC – unburned fully-stocked site (control), BNC – restoration-burned fully-stocked site, B50 – silviculturally-burned clearcut site with 50 m3 ha–1 green tree retention, UBCC – unburned complete clearcut site with no green tree retention. View larger in new window/tab.
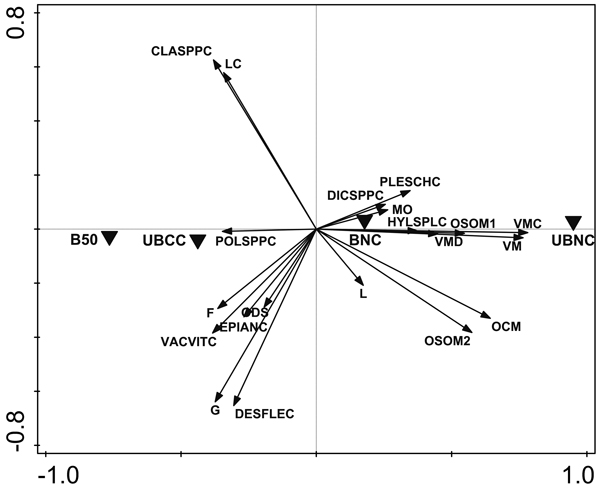
Fig. 3. Unconstrained PCA ordination results for soil and vegetation parameters, with sites as environmental variables. The variable titles as follows: OCM – organic hemic and sapric, i.e. Oe/Oa horizon (humus layer) thickness; OSOM1 – humus layer soil organic matter (SOM), %; OSOM2 – humus layer SOM stock, g m–2; L – litter mass; MO – moss biomass; VM – Vaccinium myrtillus biomass; VMD – dead V. myrtillus mass; ODS – biomass of dwarf-shrubs other than V. myrtillus, practically mostly Vaccinium vitis-idaea; F – forb biomass; G – graminoid biomass; LC – lichen biomass; CLASPPC – Cladonia spp. cover; PLESCHC – Pleurozium schreberi cover; DICSPPC – Dicranum spp. cover; HYLSPLC – Hylocomium splendens cover; VMC – V. myrtillus cover; POLSPPC – Polytrichum spp. cover; VACVITC – V. vitis-idaea cover; EPIANC – Epilobium angustifolium cover; DESFLEC – Deschampsia flexuosa cover. UBNC – unburned fully-stocked site (control); BNC – restoration-burned fully-stocked site; B50 – silviculturally-burned clearcut site with 50 m3 ha–1 green tree retention; UBCC – unburned complete clearcut site with no green tree retention.
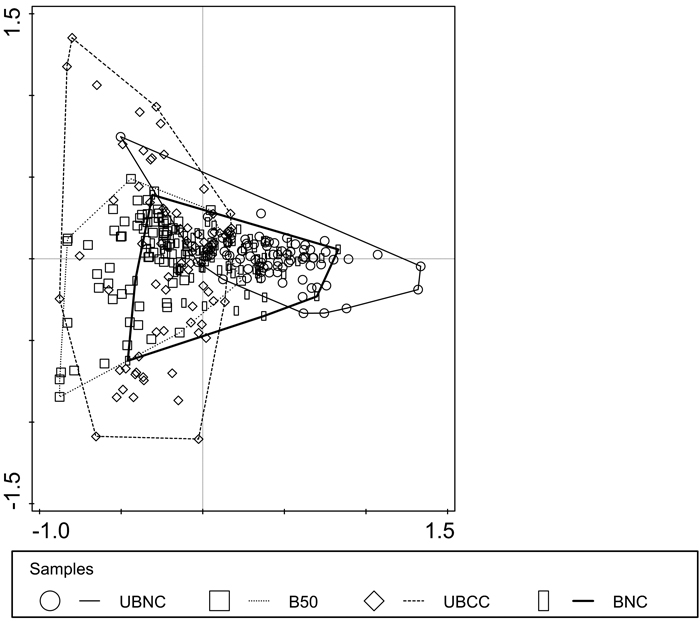
Fig. 4. Multivariate sample dissimilarity plot by site with enclosing envelopes. UBNC – unburned fully-stocked site (control); BNC – restoration-burned fully-stocked site; B50 – silviculturally-burned clearcut site with 50 m3 ha–1 green tree retention; UBCC – unburned complete clearcut site with no green tree retention.
| Table 4. Null hypothesis keeping rates in testing for differences between sites and treatments, based on simulation results | ||
| Organic hemic and sapric, i.e. Oe/Oa horizon (humus layer) soil organic matter (SOM) stocks (log-transformed) | P | |
| nrep = 1, nsample = 30 | 0.07 | |
| var = 10% | nrep = 3, nsample = 80 | 0.05* |
| nrep = 4, nsample = 30 | 0.03* | |
| nrep = 5, nsample = 30 | 0.01** | |
| nrep = 6, nsample = 30 | < 0.001*** | |
| var = 20% | nrep = 3, nsample = 80 | 0.25 |
| nrep = 4, nsample = 30 | 0.15 | |
| nrep = 5, nsample = 30 | 0.08 | |
| nrep = 6, nsample = 30 | 0.03* | |
| var = 50% | nrep = 3, nsample = 80 | 0.67 |
| nrep = 4, nsample = 30 | 0.42 | |
| nrep = 5, nsample = 30 | 0.35 | |
| nrep = 6, nsample = 30 | 0.22 | |
| Mineral soil organic matter (SOM) stocks (log-transformed) | P | |
| nrep = 1, nsample = 90 | 0.046* | |
| var = 10% | nrep = 3, nsample = 90 | 0.57 |
| nrep = 4, nsample = 30 | 0.49 | |
| nrep = 5, nsample = 30 | 0.44 | |
| nrep = 6, nsample = 30 | 0.3 | |
| Ground and field-layer biomass | P | |
| nrep = 1, nsample = 30 | 0.007** | |
| var = 10% | nrep = 3, nsample = 90 | 0.02* |
| nrep = 3, nsample = 80 | 0.06 | |
| nrep = 4, nsample = 30 | 0.01** | |
| nrep = 5, nsample = 30 | < 0.001*** | |
| nrep = 6, nsample = 30 | < 0.001*** | |
| var = 20% | nrep = 3, nsample = 90 | 0.12 |
| nrep = 4, nsample = 30 | 0.05* | |
| nrep = 5, nsample = 30 | < 0.001*** | |
| nrep = 6, nsample = 30 | < 0.001*** | |
| var = 50% | nrep = 3, nsample = 90 | 0.59 |
| nrep = 4, nsample = 30 | 0.4 | |
| nrep = 5, nsample = 30 | 0.2 | |
| nrep = 6, nsample = 30 | 0.12 | |
| nrep = 6, nsample = 60 | 0.08 | |
| nrep = 6, nsample = 120 | 0.08 | |
| var – the proportion of total variance assumed to be due to variability between replicates; nrep – number of replicates; nsample – number of samples per replicate; P – null hypothesis keeping rate, significance levels: * – p < 0.05, ** – p < 0.01, *** – p < 0.001. | ||