| Table 1. Geographical locations of Pinus sylvestris populations studied using nuclear and chloroplast microsatellites markers. Native populations are from Poland (PL) divided for three climatic regions: I– Central Poland, II– North Poland, III– South Poland while reference populations are from Finland (F), Turkey (T), Spain (Sp), Scotland (S). Populations from Turkey, Spain and Scotland represent marginal populations, while other samples are from the central pine distribution area. | ||||
| Code | Provenance name | Latitude, Longitude | Altitude | Region |
| PL1 | Karsko | 52°54´N, 15°15´E | 75 | I |
| PL2 | Tabórz | 53°52´N, 19°55´E | 110 | II |
| PL3 | Dłużek | 53°31´N, 20°38´E | 145 | II |
| PL4 | Ruciane | 53°37´N, 21°35´E | 145 | II |
| PL5 | Rozpuda | 53°55´N, 22°55´E | 205 | II |
| PL6 | Supraśl | 53°15´N, 23°20´E | 165 | II |
| PL7 | Starzyna | 52°38´N, 23°37´E | 170 | II |
| PL8 | Gubin | 51°55´N, 14°50´E | 70 | I |
| PL9 | Rychtal | 51°12´N, 17°50´E | 190 | I |
| PL10 | Bolewice | 52°23´N, 16°10´E | 90 | I |
| PL11 | Lipowa | 53°44´N, 18°15´E | 130 | II |
| PL12 | Jegiel | 52°40´N, 21°40´E | 95 | II |
| PL13 | Spała | 51°35´N, 20°15´E | 150 | I |
| PL14 | Janów Lubelski | 50°40´N, 22°25´E | 250 | I |
| PL15 | Nowy Targ | 49°20´N, 20°20´E | 590 | III |
| PL16 | Piwniczna | 49°20´N, 20°17´E | 500 | III |
| F17 | Finland_Joutsa | 61°74´N, 26°14´E | 125 | IV |
| F18 | Finland_Kielajoki | 69°65´N, 29°07´E | 100 | |
| T19 | Turkey_Çatacık | 39°96´N, 31°11´E | 1619 | V |
| T20 | Turkey_Bayabat-Sinop | 41°64´N, 34°83´E | 1228 | |
| Sp21 | Spain_Sierra de Neila | 42°05´N, 03°01´W | 1400 | VI |
| Sp22 | Spain_Puerto de Navafría | 40°98´N, 03°81´W | 1800 | |
| S23 | Scotland | 57°30´N, 05°38´W | 81 | VII |
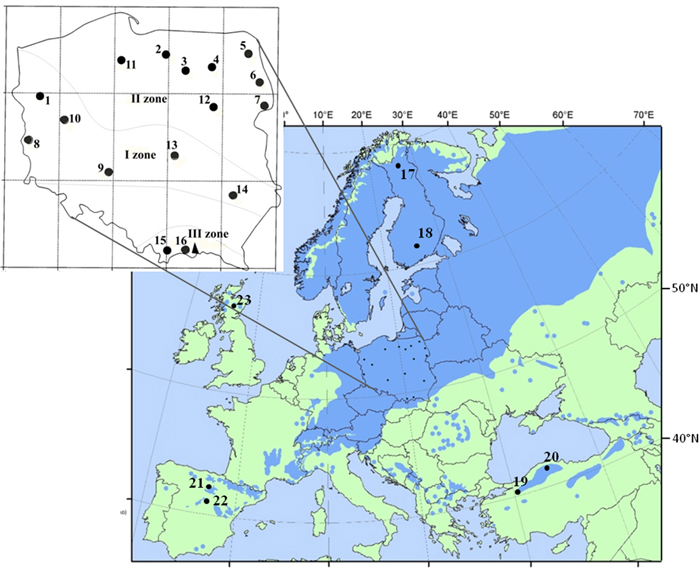
Fig. 1. Location of 16 Polish provenances of Scots pine derived from three climatic zones and reference populations of the species distribution range in Europe and Asia. Population acronyms are as in Table 1.
| Table 2. Genetic parameters for the nuclear microsatellite loci tested in all Polish pine populations. N – number of alleles per locus, R – range of allele size, A – mean number of alleles per locus, Ae – mean effective number of alleles per locus, Ho – mean observed heterozygosity, He – mean expected heterozygosity, F – mean fixation index, null – null allele frequency, ns – non significant, * P ≤ 0.05. | |||||||||
| Locus | N | R | A | Ae | Ho | He | F | null | Deviation from HW equlibrium |
| psyl42 | 6 | 165–177 | 4.19 | 3.31 | 0.673 | 0.698 | 0.035 | 0.000 | ns |
| psyl25Δ | 2 | 213–216 | 1.56 | 1.07 | 0.040 | 0.062 | 0.343 | 0.014 | * |
| psyl18ΔΔ | 6 | 287–305 | 2.50 | 1.14 | 0.119 | 0.124 | 0.041 | 0.000 | ns |
| psyl44 | 5 | 166–178 | 3.06 | 1.27 | 0.209 | 0.215 | 0.030 | 0.000 | ns |
| psyl57 | 7 | 184–202 | 5.38 | 2.35 | 0.561 | 0.575 | 0.024 | 0.006 | * |
| psyl36 | 5 | 245–257 | 3.56 | 1.37 | 0.275 | 0.270 | –0.016 | 0.000 | ns |
| PtTX4011 | 10 | 229–279 | 5.19 | 2.94 | 0.459 | 0.660 | 0.304 | 0.079 | * |
| Spac11.4 | 21 | 122–170 | 10.94 | 7.84 | 0.803 | 0.872 | 0.079 | 0.006 | * |
| PtTX3025 | 10 | 206–298 | 5.94 | 2.61 | 0.548 | 0.617 | 0.112 | 0.018 | * |
| PtTX4001 | 16 | 199–243 | 7.69 | 3.37 | 0.536 | 0.703 | 0.237 | 0.054 | * |
| Δ – locus monomorphic for populations: PL2, PL3, PL5, PL11, PL12, PL14, F17, F18, Sp21, S23 ΔΔ – locus monomorphic for PL11 | |||||||||
| Table 3. Characteristics of the chloroplast microsatellite loci used to study Scots pine from the Polish species distribution. N – number of alleles per locus, R – range of allele size, A – mean number of alleles per locus, Ae – mean effective number of alleles per locus, uh – unbiased allelic diversity. | |||||
| Locus | N | R | A | Ae | uh |
| PCP36567 | 4 | 108–111 | 2.25 | 1.40 | 0.291 |
| PCP30277 | 8 | 130–137 | 5.69 | 3.68 | 0.754 |
| PCP102652Δ | 4 | 109–115 | 1.81 | 1.10 | 0.081 |
| PCP26106 | 4 | 142–145 | 2.94 | 1.71 | 0.422 |
| PCP87314 | 4 | 111–114 | 3.32 | 1.51 | 0.336 |
| PCP45071 | 6 | 146–152 | 3.63 | 1.75 | 0.427 |
| PCP1289 | 4 | 107–110 | 3.19 | 1.75 | 0.430 |
| PCP41131ΔΔ | 5 | 135–139 | 2.00 | 1.23 | 0.182 |
| Δ – locus monomorphic for populations: PL7, PL8, PL9, PL10, PL12, PL14, PL16, F18, F19, Sp21, Sp22, S23 ΔΔ – locus monomorphic for populations: PL10, PL12, PL16, F18 | |||||
| Table 4. Genetic diversity of Scots pine populations in Poland based on nuclear microsatellite loci. A – mean number of alleles per locus, Ae – mean effective number of alleles per locus, Ap – number of private alleles, AR – allelic richness, Ho – mean observed heterozygosity, He – mean expected heterozygosity, F – mean fixation index, LGP – latent genetic potential, * statistically significant differentiation of populations (P ≤ 0.05). | |||||||||
| nSSR diversity | |||||||||
| Population | Sample size | A | Ae | AP | AR | Ho | He | F | LGP |
| PL1 Karsko | 19 | 4.80 | 2.66 | 0 | 4.59 | 0.496 | 0.506 | 0.005 | 21.42 |
| PL8 Gubin | 19 | 5.30 | 2.84 | 0 | 5.16 | 0.487 | 0.492 | –0.001 | 24.61 |
| PL9 Rychtal | 24 | 4.50 | 2.63 | 0 | 4.81 | 0.388 | 0.491 | 0.180 | 18.70 |
| PL10 Bolewice | 21 | 5.00 | 2.48 | 0 | 4.99 | 0.407 | 0.436 | 0.053 | 25.20 |
| PL13 Spała | 20 | 5.10 | 2.72 | 1 | 4.41 | 0.457 | 0.473 | 0.010 | 23.82 |
| PL14 Janów Lubelski | 23 | 4.90 | 2.41 | 0 | 4.83 | 0.376 | 0.445 | 0.108 | 24.91 |
| PL2 Tabórz | 23 | 4.40 | 2.45 | 0 | 4.76 | 0.390 | 0.425 | 0.051 | 19.53 |
| PL3 Dłużek | 21 | 4.90 | 2.39 | 1 | 4.20 | 0.456 | 0.482 | 0.037 | 25.12 |
| PL4 Ruciane | 22 | 5.30 | 2.84 | 2 | 4.86 | 0.452 | 0.501 | 0.062 | 24.59 |
| PL5 Rozpuda | 23 | 5.00 | 2.74 | 0 | 5.13 | 0.424 | 0.464 | 0.077 | 22.60 |
| PL6 Supraśl | 21 | 5.10 | 2.47 | 0 | 4.82 | 0.438 | 0.465 | 0.010 | 26.35 |
| PL7 Starzyna | 22 | 5.50 | 2.70 | 1 | 4.85 | 0.411 | 0.461 | 0.075 | 27.99 |
| PL11 Lipowa | 21 | 5.10 | 2.27 | 2 | 4.74 | 0.415 | 0.445 | 0.037 | 28.29 |
| PL12 Jegiel | 21 | 5.10 | 2.55 | 0 | 4.91 | 0.411 | 0.471 | 0.070 | 25.51 |
| PL15 Nowy Targ | 23 | 5.10 | 2.24 | 1 | 4.64 | 0.361 | 0.417 | 0.085 | 28.58 |
| PL16 Piwniczna | 23 | 4.90 | 2.35 | 0 | 4.69 | 0.404 | 0.417 | 0.024 | 25.53 |
| Population means (regions) | |||||||||
| I | 126 | 4.9 | 2.62 | 1.0 | 4.80 | 0.435 | 0.474 | 0.059 | 23.11 |
| II | 174 | 5.1 | 2.55 | 6.0 | 4.78 | 0.425 | 0.464 | 0.052 | 25.00 |
| III | 46 | 5.0 | 2.29 | 1.0 | 4.67 | 0.383 | 0.417 | 0.054 | 27.06 |
| Population means (central populations) | |||||||||
| Finland | 49 | 5.2 | 2.49 | 0.5 | 4.74 | 0.484 | 0.448 | –0.049 | 28.34 |
| Poland | 346 | 5.0 | 2.55 | 0.5 | 4.77 | 0.423 | 0.462 | 0.055 | 24.55 |
| Populations means (marginal populations) | |||||||||
| Turkey | 50 | 4.65 | 2.35 | 3 | 4.42 | 0.461 | 0.478 | 0.069 | 23.40 |
| Spain | 60 | 4.75 | 2.46 | 1 | 4.37 | 0.445 | 0.462 | 0.079 | 22.88 |
| Scotland | 39 | 5.70 | 2.66 | 1 | 4.82 | 0.476 | 0.482 | 0.000 | 30.38 |
| Central vs. marginal populations | |||||||||
| Central | 395 | 5.01 | 2.53 | 1.3 | 4.76* | 0.435 | 0.462 | 0.037 | 25.03 |
| Marginal | 149 | 5.03 | 2.49 | 1.7 | 4.54* | 0.461 | 0.474 | 0.049 | 25.55 |
| Table 5. Genetic diversity of Scots pine populations in Poland based on chloroplast microsatellite loci. Ah – mean number of haplotypes, Ae – mean effective number of haplotypes, AP – number of private haplotypes, AR – haplotype richness, Hd – haplotype diversity, D2sh – mean genetic distance of individuals within populations. | |||||||
| cpSSR diversity | |||||||
| Population | Sample size | Ah | Ae | AP | AR | Hd | D2sh |
| PL1 Karsko | 23 | 20 | 18.24 | 7 | 17.51 | 0.988 | 2.518 |
| PL8 Gubin | 24 | 14 | 10.67 | 5 | 11.97 | 0.946 | 1.719 |
| PL9 Rychtal | 23 | 21 | 19.59 | 3 | 18.34 | 0.992 | 2.015 |
| PL10 Bolewice | 24 | 19 | 16.94 | 3 | 16.20 | 0.982 | 1.759 |
| PL13 Spała | 22 | 18 | 16.13 | 7 | 16.36 | 0.983 | 2.797 |
| PL14 Janów Lubelski | 23 | 19 | 16.03 | 8 | 16.60 | 0.980 | 2.536 |
| PL2 Tabórz | 23 | 20 | 18.24 | 9 | 17.51 | 0.988 | 2.875 |
| PL3 Dłużek | 21 | 19 | 17.64 | 8 | 18.00 | 0.990 | 2.818 |
| PL4 Ruciane | 24 | 20 | 18.00 | 8 | 16.96 | 0.986 | 3.706 |
| PL5 Rozpuda | 23 | 18 | 14.30 | 6 | 15.69 | 0.972 | 1.989 |
| PL6 Supraśl | 21 | 21 | 21.00 | 11 | 20.00 | 1.000 | 4.089 |
| PL7 Starzyna | 21 | 17 | 12.60 | 7 | 16.00 | 0.967 | 1.883 |
| PL11 Lipowa | 24 | 19 | 16.00 | 6 | 16.09 | 0.978 | 1.969 |
| PL12 Jegiel | 24 | 19 | 16.00 | 2 | 16.09 | 0.978 | 1.879 |
| PL15 Nowy Targ | 24 | 22 | 20.57 | 6 | 18.48 | 0.993 | 2.014 |
| PL16 Piwniczna | 24 | 19 | 14.40 | 5 | 15.98 | 0.971 | 1.757 |
| Population means (regions) | |||||||
| I | 139 | 18.9 | 16.53 | 5.5 | 16.67 | 0.981 | 2.468 |
| II | 181 | 19.2 | 16.96 | 7.1 | 17.36 | 0.984 | 2.894 |
| III | 48 | 17.5 | 15.13 | 5.5 | 15.15 | 0.969 | 1.867 |
| Population means (central populations) | |||||||
| Finland | 49 | 20.0 | 17.96 | 7.3 | 16.36 | 0.979 | 2.041 |
| Poland | 368 | 19.1 | 16.65 | 6.3 | 16.74 | 0.981 | 2.395 |
| Populations means (marginal populations) | |||||||
| Turkey | 50 | 18.0 | 14.66 | 6.5 | 14.86 | 0.970 | 4.794 |
| Spain | 60 | 21.5 | 16.80 | 10.5 | 15.38 | 0.972 | 3.091 |
| Scotland | 38 | 27.0 | 19.00 | 11.0 | 15.74 | 0.973 | 2.208 |
| Central vs. marginal populations | |||||||
| Central | 417 | 19.5 | 16.74 | 5.5 | 16.73 | 0.981 | 2.346 |
| Marginal | 148 | 21.2 | 16.38 | 9.0 | 15.24 | 0.971 | 3.596 |
| Table 6. Hierarchical analysis of molecular variance (AMOVA) at nuclear loci (nSSR diversity) and at chloroplast loci (cpSSR diversity) based on the allelic distance matrix, df – degrees of freedom, SS – sum of squares, MS – mean squares, p – probability. | ||||||||
| nSSR diversity | cpSSR diversity | |||||||
| Variance component | df | SS | MS | Variance | % Total | p | % Total | p |
| Polish populations | ||||||||
| Among Regs | 2 | 20.185 | 10.093 | 0.016 | 0 | 0.095 | 0 | 0.165 |
| Among Pops | 13 | 107.865 | 8.297 | 0.139 | 3 | 0.001 | 0 | 0.956 |
| Within Pops | 330 | 1750.996 | 5.306 | 5.306 | 97 | 0.001 | 100 | 0.893 |
| Total | 345 | 1879.046 | ||||||
| Population means (central populations) | ||||||||
| Among Regs | 3 | 28.730 | 9.577 | 0.013 | 0 | 0.120 | 0 | 0.507 |
| Among Pops | 14 | 115.596 | 8.257 | 0.141 | 3 | 0.001 | 0 | 0.585 |
| Within Pops | 377 | 1953.509 | 5.182 | 5.182 | 97 | 0.001 | 100 | 0.657 |
| Total | 394 | 2097.835 | ||||||
| Central vs. marginal populations | ||||||||
| Among Regs | 1 | 122.613 | 122.613 | 0.503 | 8 | 0.001 | 1 | 0.003 |
| Among Pops | 21 | 258.106 | 12.291 | 0.299 | 5 | 0.001 | 0 | 0.256 |
| Within Pops | 521 | 2761.401 | 5.300 | 5.300 | 87 | 0.001 | 99 | 0.007 |
| Total | 543 | 3142.119 | ||||||
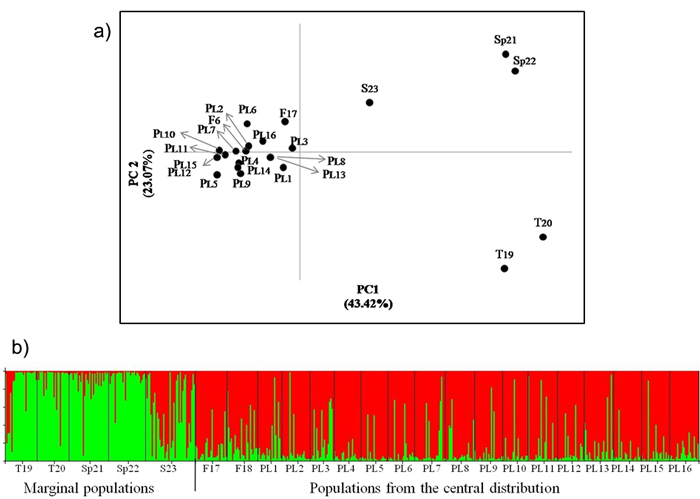
Fig. 2. a) Principal coordinates plot showing the genetic relationship of the Scots pine populations from the wide distribution of this species. The proportion of variance accounted for by the first two axes was 66.49%, b) Assignment of investigated populations to the two genetic clusters (K = 2) found in the STRUCTURE analysis based on nuclear microsatellite markers. Population acronyms are as in Table 1.