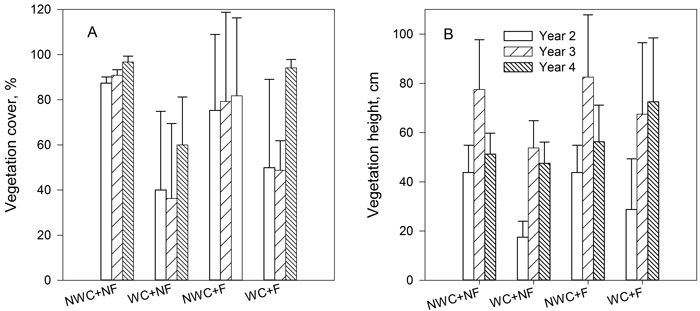
Fig. 1. Development of vegetation cover (%) (A), and height (cm) (B) over time. Bars indicate standard deviation. NWC = no weed control; WC = weed control; NF = no fertilization; F = fertilization.
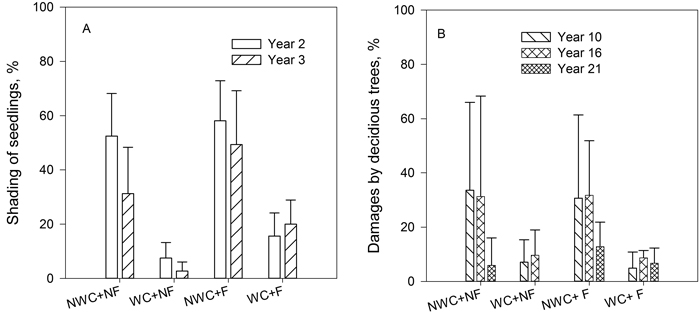
Fig. 2. The influence of vegetation in terms of shading (%) (A), and damage by broadleaved trees (%) to Scots pine seedlings (B). Bars indicate standard deviation. NWC = no weed control; WC = weed control; NF = no fertilization; F = fertilization.
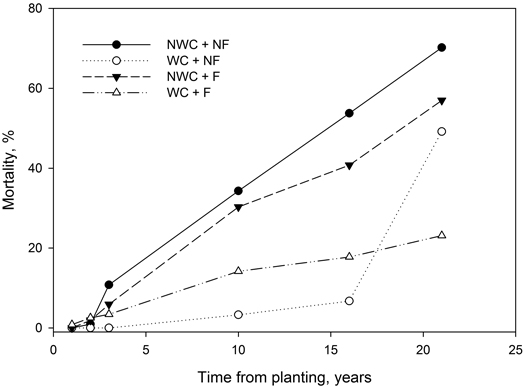
Fig. 3. Changes in Scots pine mortality (%) over time by treatment (NWC = no weed control; WC = weed control; NF = no fertilization; F = fertilization).
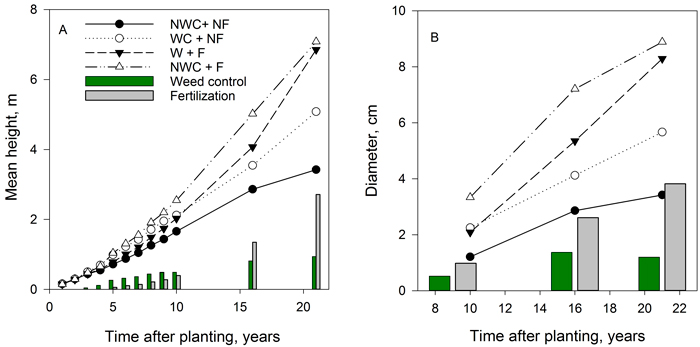
Fig. 4. Changes in Scots pine height (m) (A), and diameter at breast height (cm) (B) over time. Bars show the factorial main effects of weed control and fertilization. NWC = no weed control; WC = weed control; NF = no fertilization; F = fertilization.
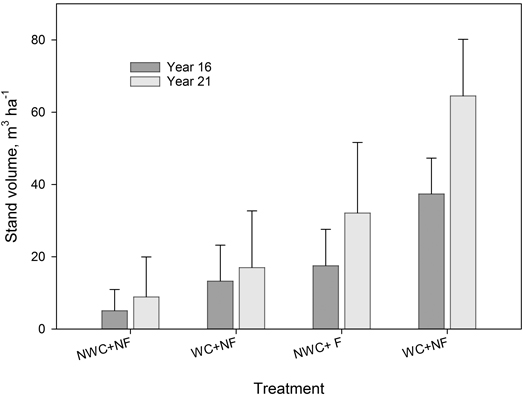
Fig. 5. Scots pine stand volume (m3 ha–1) at years 16 and 21 by treatment (NWC = no weed control; WC = weed control; NF = no fertilization; F = fertilization).
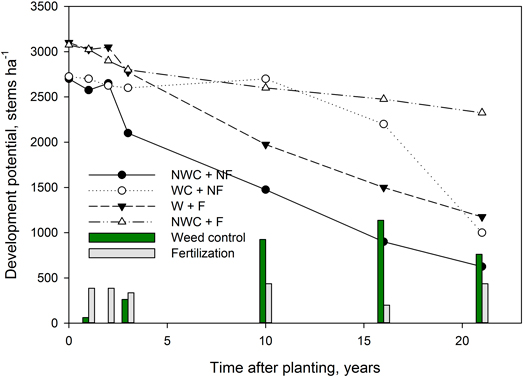
Fig. 6. Changes in Scots pine trees exhibiting good development potential (stems ha–1) by treatment. The bars show the factorial main effects of weed control and fertilization. NWC = no weed control; WC = weed control; NF = no fertilization; F = fertilization.
| Table 1. The effect of weed control and fertilization on Scots pine foliar nutrients in a trial established on a peat-based, former agricultural land, northern Ostrobothnia, Finland. “Year” indicates changes in nutrient concentrations over time. Values marked in bold are significant at p < 0.05. | |||||||
| Variable | Weed control | Fertilization | Weed control × Fertilization | Year | Year × Weed control | Year × Fertilization | Year × Weed control × Fertilization |
| N | 0.590 | 0.227 | 0.443 | 0.182 | 0.728 | 0.941 | 0.445 |
| P | 0.019 | 0.863 | 0.207 | 0.000 | 0.384 | 0.166 | 0.129 |
| K | 0.392 | 0.036 | 0.831 | 0.000 | 0.157 | 0.184 | 0.782 |
| Ca | 0.428 | 0.439 | 0.602 | 0.001 | 0.106 | 0.001 | 0.254 |
| Mg | 0.039 | 0.280 | 0.588 | 0.000 | 0.001 | 0.005 | 0.002 |
| Mn | 0.824 | 0.123 | 0.046 | 0.000 | 0.661 | 0.001 | 0.686 |
| Fe | 0.485 | 0.532 | 0.898 | 0.000 | 0.790 | 0.847 | 0.912 |
| Cu | 0.272 | 0.880 | 0.124 | 0.011 | 0.373 | 0.743 | 0.574 |
| Zn | 0.851 | 0.020 | 0.002 | 0.008 | 0.148 | 0.049 | 0.698 |
| B | 0.806 | 0.001 | 1.033 | 0.000 | 0.061 | 0.001 | 0.341 |
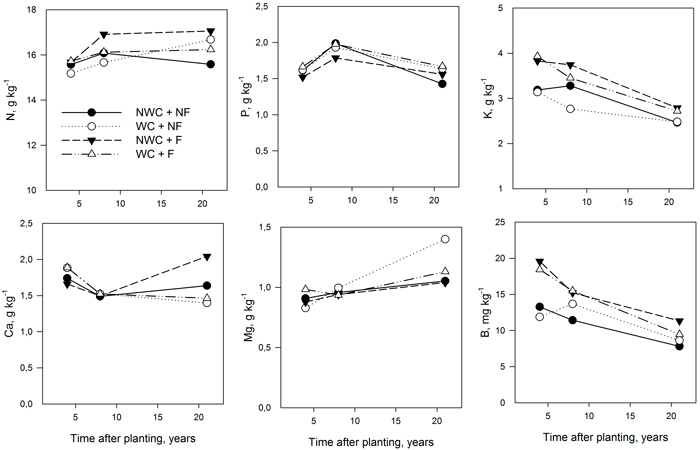
Fig. 7. Changes in Scots pine foliar N, P, K, Ca Mg and B concentrations by treatment (NWC = no weed control; WC = weed control; NF = no fertilization; F = fertilization). View larger in new window/tab