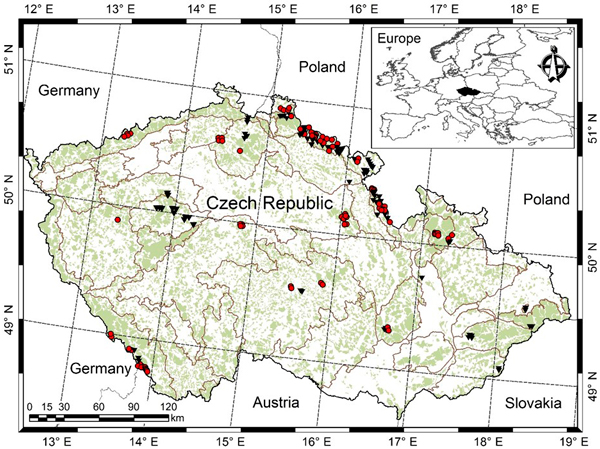
Fig. 1. Location of sample plots [purely Norway spruce or Norway spruce-dominated sample plots (red dots), purely European beech or European beech-dominated sample plots (black triangles), light green shade represents forest cover, and grey lines separating Natural Forest Area].
| Table 1. Summary statistics of modelling data [CDBDR = ratio of maximum crown diameter to diameter at breast height, in short, crown-to-bole diameter ratio; SD = standard deviation]. | ||
| Variables | Mean ± SD (range) | |
| Norway spruce | European beech | |
| Number of sample plots | 90 (16 monospecific + 74 mixed) | 88 (18 monospecific + 70 mixed) |
| Total number of CDBDR sample trees | 5526 | 5666 |
| Number of CDBDR trees per sample plot | 170 ± 140 (1–450) | 119 ± 81 (1–287) |
| Number of stems per sample plot | 214 ± 105 ( 23–660) | 147 ± 129 (8–677) |
| Number of stems (N ha–1) | 820 ± 472 (86–2581) | 641 ± 474 (34–2685) |
| Stand basal area (BA, m2 ha–1) | 49.7 ± 31 (6.9–81.2) | 55.3 ± 45 (13–81.2) |
| BA proportion of a tree species (BAPOR) | 0.72 ± 0.3 (0.00057–1) | 0.74 ± 0.26 (0.004–1) |
| BA of trees lager than a subject tree (BAL, m2 ha–1) | 34.3 ± 21.4 (0–77.4) | 36 ± 19.2 (0–79.7) |
| Quadratic mean DBH per sample plot (QMD, cm) | 27.4 ± 10.4 (7–60.3) | 34 ± 10.9 (15–66.8) |
| Ratio of DBH to QMD | 1.2 ± 0.5 (0.1–7) | 0.9 ± 0.6 (0.1–5) |
| Arithmetic mean DBH per sample plot (cm) | 24.6 ± 10.8 (6.8–53.9) | 30 ± 11.6 (9–66.3) |
| DBH sum per sample plot (cm) | 4520 ± 1302 (1063–9246) | 3750 ± 1431 (683–9246) |
| Dominant diameter per sample plot (cm) | 46.1 ± 15.2 (9.2–72.8) | 53.6 ± 10.2 (23.4–73) |
| Dominant height per sample plot (HDOM, m) | 25.5 ± 9.3 (6.5–40.4) | 29.2 ± 7.2 (13.3–41.5) |
| Total height (m) | 16.1 ± 10.3 (2–48.7) | 19.6 ± 9.9 (2–48) |
| Ratio of height to diameter (m cm–1) | 0.73 ± 0.22 (0.1–2.1) | 0.74 ± 0.3 (0.1–2.7) |
| Height to crown base (HCB, m) | 5.6 ± 5.5 (0–32.1) | 8.2 ± 6.3 (0–34.1) |
| Crown diameter (m) | 3.6 ± 1.6 (0.7–11.9) | 5.9 ± 2.9 (0.9–19.7) |
| Diameter at breast height (DBH, cm) | 25.4 ± 18.4 (3.1–112) | 29.9 ± 19.4 (3.4–116.1) |
| Crown-to-bole diameter ratio (CDBDR, m cm–1) | 0.2 ± 0.07 (0.04–0.67) | 0.3 ± 0.16 (0.03–0.99) |
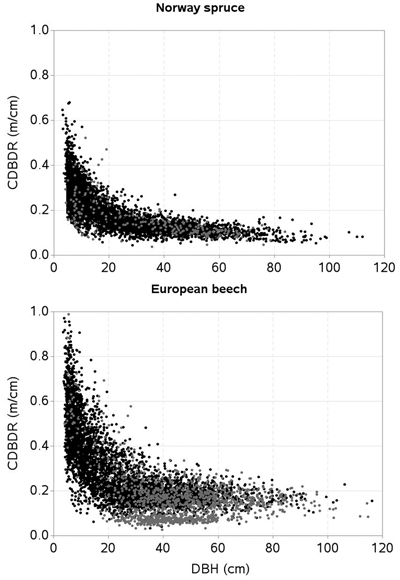
Fig. 2. Crown-to-bole diameter ratio (CDBDR) plotted against diameter at breast height (DBH) of trees [black dots = dense stands; grey dots = sparse stands].
| Table 2. Parameter estimates, variance components, and fit statistics of the mixed-effects CDBDR model (Eq. 9) [ | ||||
| Model components | Norway spruce | European beech | ||
| Spatially explicit | Spatially inexplicit | Spatially explicit | Spatially inexplicit | |
| Fixed | ||||
| α1 | 2.439952 (0.0962) | 2.010637 (0.0756) | 0.974352 (0.0634) | 1.188444 (0.0750) |
| α2 | 0.079471 (0.00492) | 0.148253 (0.00784) | 0.41734 (0.0155) | 0.368927 (0.014) |
| α3 | –0.02038 (0.00211) | –0.00643 (0.0007) | –0.00932 (0.000965) | –0.01011 (0.000917) |
| α4 | –0.70457 (0.0393) | –0.53672 (0.034) | –0.33188 (0.0573) | –0.46398 (0.0559) |
| α5 | –0.02489 (0.00239) | –0.02571 (0.00248) | –0.08355 (0.00297) | –0.08228 (0.00276) |
| φ1 | 1.431184 (0.0211) | 1.451109 (0.0214) | 1.313027 (0.0199) | 1.27803 (0.0184) |
| φ2 | 0.070045 (0.0114) | 0.056779 (0.0116) | 0.010468 (0.00186) | 0.011452 (0.00153) |
| Variance | ||||
| σ2ui1 | 1.8217 | 2.0167 | 3.1853 | 3.2148 |
| σui1ui2 | –0.4162 | –0.6051 | –0.9902 | –0.7329 |
| σ2ui2 | 0.0926 | 0.1189 | 0.1572 | 0.05182 |
| σ2 | 0.00131 | 0.00142 | 0.00511 | 0.00305 |
| Fit statistics | ||||
| 0.6994 | 0.6849 | 0.7559 | 0.7503 | |
| 0.7286 | 0.7104 | 0.7791 | 0.7657 | |
| RMSE | 0.0349 | 0.0371 | 0.0626 | 0.0653 |
| AIC | –24702 | –24551 | –23931 | –23804 |
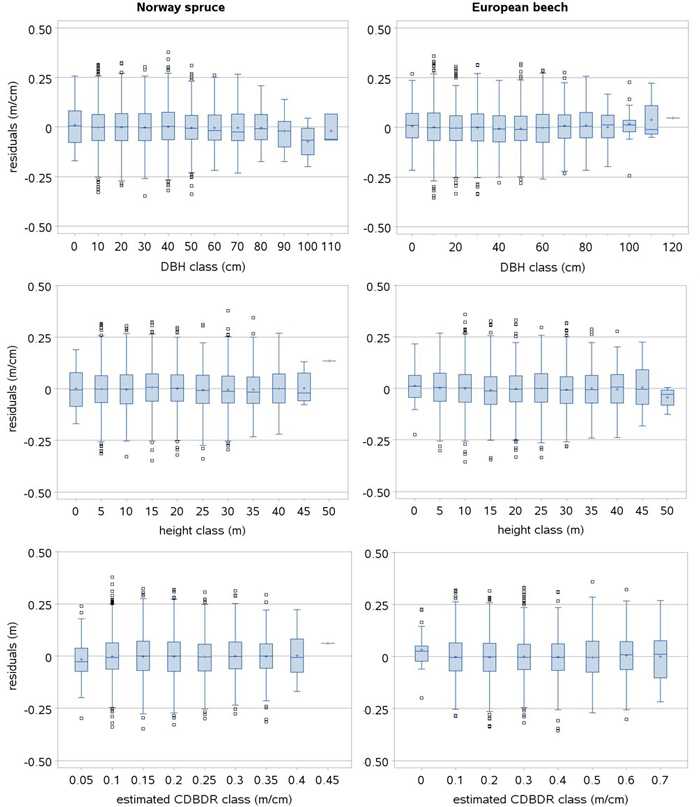
Fig. 3. Box plots of the standardized residuals of the spatially inexplicit crown-to-bole diameter ratio (CDBDR) model (Eq. 9). Length of larger box represents the interquartile range (IQR), length of whisker represents class minimum and maximum values in the IQR, and smaller boxes represent the observations 1.5 times beyond the IQR (outlier observations lying far away from the median) and horizontal lines and plus signs in a larger box represent class median and mean values, respectively.
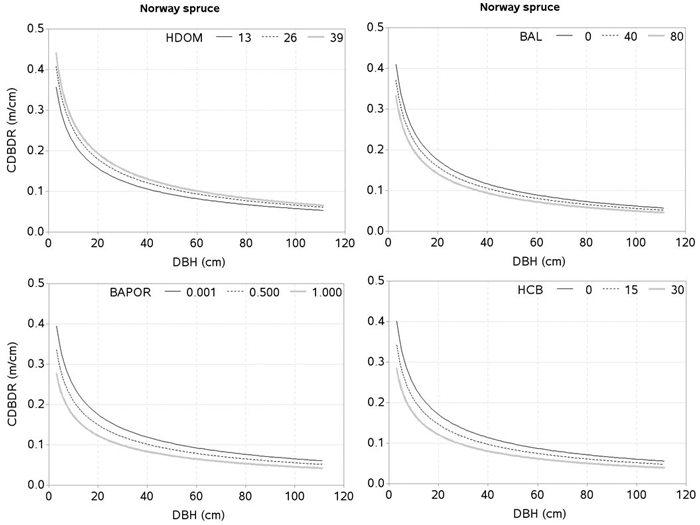
Fig. 4. Effects of dominant height (HDOM), basal area of trees larger in diameters than a subject tree (BAL), basal area proportion of Norway spruce (BAPOR), and height to crown base (HCB) on crown-to bole-diameter ratio (CDBDR). Curves were produced using parameter estimates in Table 2 (spatially inexplicit model for dense stands). Mean values of the data were used as predictors except the variable of interest in each figure, which varied from about minimum to maximum in the data (see Table 1).
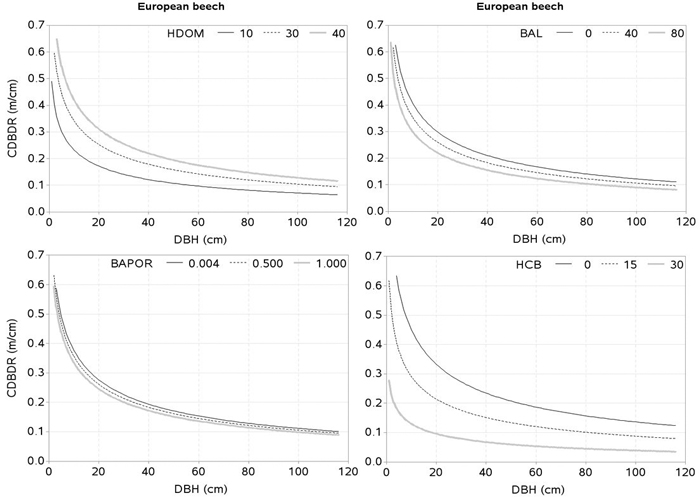
Fig. 5. Effects of dominant height (HDOM), basal area of trees larger in diameters than a subject tree (BAL), basal area proportion of European beech (BAPOR), and height to crown base (HCB) on crown-to bole-diameter ratio (CDBDR). Curves were produced using parameter estimates in Table 2 (spatially inexplicit model for dense stands). Mean values of the data were used as predictors except the variable of interest in each figure, which varied from about minimum to maximum in the data (see Table 1).
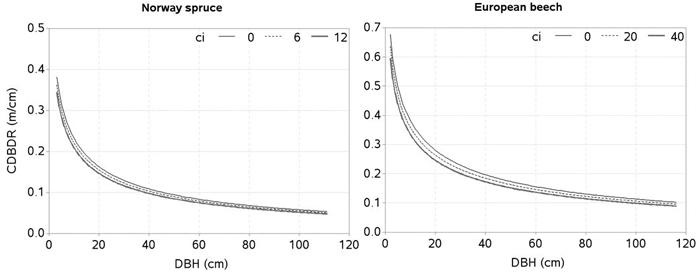
Fig. 6. Effects of spatially explicit competition (CI) on crown-to bole-diameter ratio (CDBDR). Curves were produced using parameter estimates in Table 2 (spatially explicit model for dense stands). Mean values of the data were used as predictors except the variable of interest in each figure, which varied from about minimum to maximum in the data.
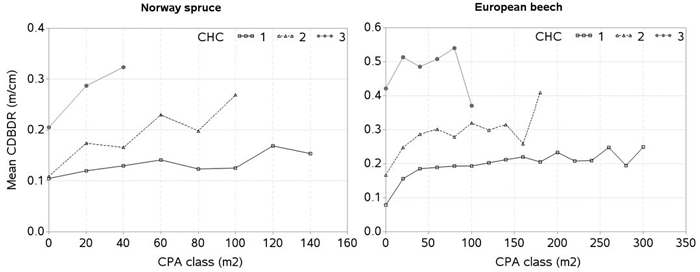
Fig. 7. Mean crown-to-bole diameter ratio (CDBDR) plotted over the crown projection area (CPA) class for each canopy height class (CHC) [mean CDBDR was calculated by CPA class with 20 m2 interval; CHC 1: height > 66% height of the tallest tree, CHC 2: 33% height of the tallest tree < height < 66% height of the tallest tree, and CHC 3: height < 33% height of the tallest tree per sample plot; zero in x-axis stands for CPA class ≤ 10 m2, but > 0 m2].