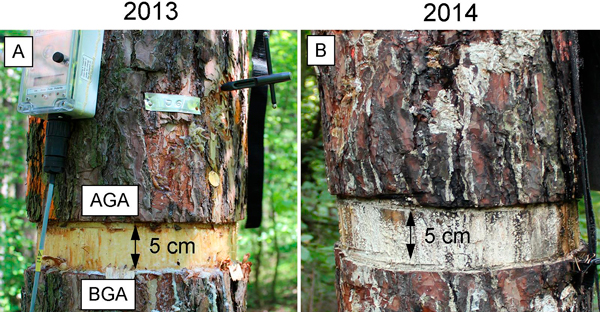
Fig. 1. Microcore sampling of girdled stems during the growing seasons of 2013 and 2014. A – the first week of July 2013 (week after girdling). B – dieback of girdled trees in July 2014. AGA – above girdling area; BGA – below girdling area.
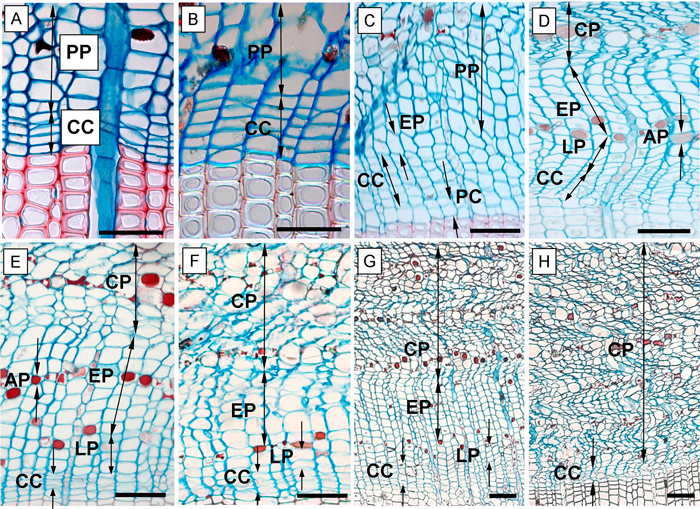
Fig. 2. Phases of annual phloem formation during the growing seasons of 2013 and 2014. A – dormant phase of cambium; B – onset of cambial activity (swelling of cambial cells); C – the first forming row of early phloem and early wood; D – fully formed annual phloem increment; E, F – phloem increment at the end of the 2013 growing season in the above girdling area (E) and below girdling area (F); G – formed annual phloem increment within above area of girdling on June 5, 2014; H – the below area of girdling with non-activated cambium and without cell increment (June 5, 2014). CC – cambial cells; PP – sieve cells of previous annual phloem increment; EP – early phloem; LP – late phloem; AP – axial parenchyma; CP – collapsing phloem cells; PC – phase of post-cambial growth. Scale bars = 100 µm.
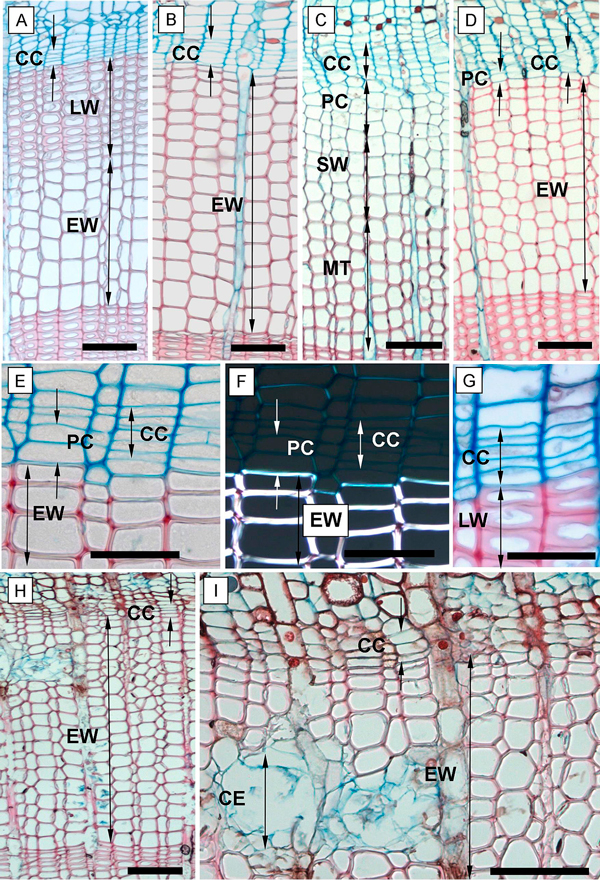
Fig. 3. Phases of xylem formation during the 2013 and 2014 growing seasons. A, B – annual ring at the end of the 2013 growing season in the above girdling area (A) and the below girdling area (B); C – tree ring formation in May 2014 of the above girdling area; D – below girdling area in May 2014 with inactivated cambium and without cell increment; E – tree ring in the below girdling area (November 2013) with undifferentiated cells of PC; F – the undifferentiated cells of PC and fully formed cells of EW under polarized light; G – fully formed and differentiated late tracheids in above girdling area (November 2013); H, I – necrosis inside girdled stems in September 2014. CC – cambial cells; PC – phase of post-cambial growth; SW – phase of secondary wall deposition; MT – completely matured tracheids; EW – earlywood; LW – latewood; CE – collapsing epithelial cells of resin canals. Scale bars: A, B, C, D, H, I = 100 µm; E, F, G = 50 µm.
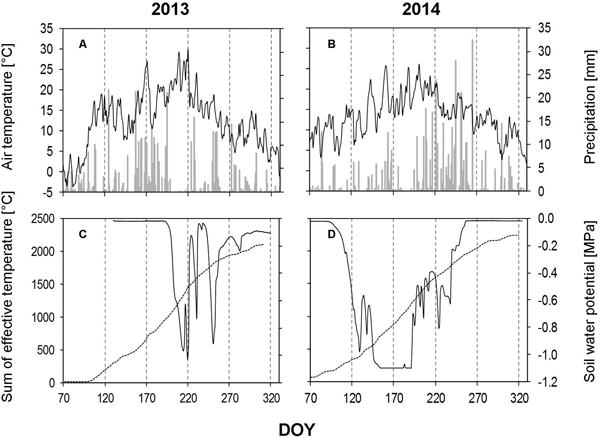
Fig. 4. Weather data and soil water potential recorded during the growing seasons of 2013 and 2014. A, B – daily precipitation amount (bars) and average daily air temperature (solid line); C, D – average daily soil water potential based on measurements obtained from all three depths (solid line) and sum of the effective temperature (dashed line). DOY – day of the year (70: March 11, 120: May 30, 170: June 19, 220: August 8, 270: September 27, 320: November 16).
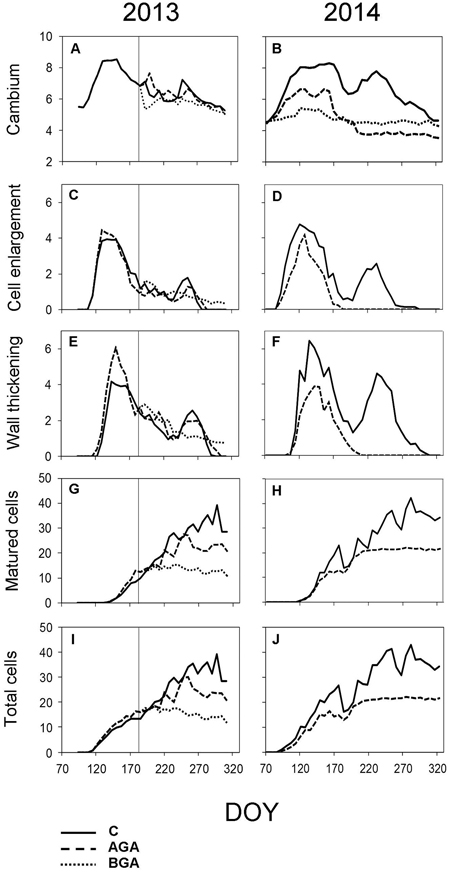
Fig. 5. Dynamics of xylem formation and cambial activity during the 2013 and 2014 growing seasons. Number of cells within cambial zone (A, B), in PC phase (C, D), in SW phase (E, F), in MT phase (G, H) and the total cell numbers within a fully formed annual tree ring (I, J). C – control trees (solid line); AGA – above girdling area (dashed line); BGA – below girdling area (dotted line). DOY – day of the year (70: March 11, 120: May 30, 170: June 19, 220: August 8, 270: September 27, 320: November 16). Solid vertical line – date of girdling.
| Table 1. Cambial activity and differentiation of xylem cells timings in six control and six girdled (above girdling) trees (2013 and 2014). | |||||||
| 2013 | 2014 | ||||||
| Parameters (DOY) | Control | AGA | K–W test | Control | AGA | K–W test | |
| CA | 108 ± 0 | 113 ± 6 | 0.058 | 87 ± 3 | 93 ± 4 | 0.026 | |
| PC | 116 ± 3 | 116 ± 3 | 1 | 94 ± 3 | 97 ± 4 | 0.241 | |
| SW | 133 ± 4 | 130 ± 5 | 0.423 | 115 ± 3 | 119 ± 7 | 0.222 | |
| MT | 148 ± 7 | 147 ± 4 | 0.600 | 127 ± 7 | 127 ± 10 | 1 | |
| CCA | 261 ± 27 | 274 ± 8 | 0.389 | 277 ± 14 | 168 ± 16 | 0.003 | |
| CPC | 259 ± 33 | 264 ± 39 | 0.131 | 268 ± 15 | 174 ± 11 | 0.004 | |
| CSW | 278 ± 29 | 296 ± 14 | 0.029 | 293 ± 13 | 190 ± 31 | 0.004 | |
| CA duration (days) | 153 ± 27 | 161 ± 6 | 1 | 190 ± 14 | 75 ± 18 | 0.004 | |
| PC duration (days) | 144 ± 36 | 148 ± 39 | 0.246 | 174 ± 12 | 77 ± 11 | 0.004 | |
| SW duration (days) | 146 ± 30 | 166 ± 10 | 0.032 | 177 ± 11 | 72 ± 33 | 0.004 | |
| P-values for Kruskal–Wallis test (H0 – Medians of all groups are equal, if p < alpha (0.05) > rejecting H0). DOY – day of year; Control – control trees; AGA – above girdling area; K–W test – results (p-values) of Kruskal–Wallis test; CA – onset of cambial activity; CCA – cessation of CA; PC – onset of postcambial growth (cell enlargement); CPC – cessation of PC; SW – onset of secondary wall deposition; CSW – cessation of SW; MT – occurrence of the first matured tracheids. Bold – statistically significant difference (alpha = 0.05). | |||||||
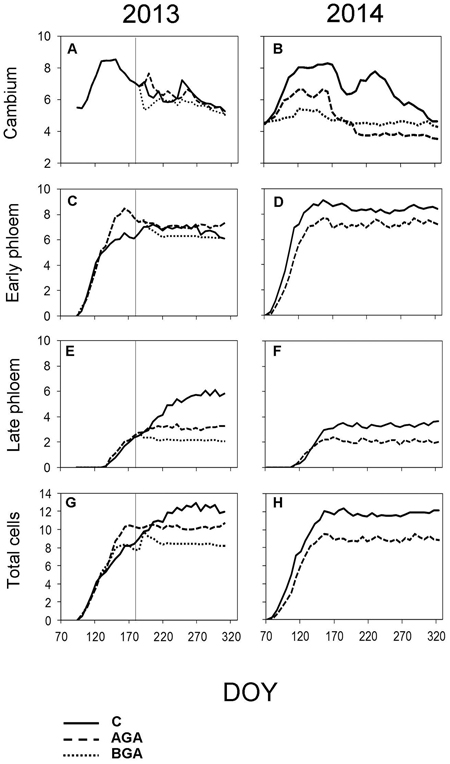
Fig. 6. Dynamics of phloem formation and cambial activity during the 2013 and 2014 growing seasons. Number of cells within cambial zone (A, B), number of EP cells (C, D) and LP cells (E, F) and the total cell numbers within fully formed annual phloem increment (G, H). C – control trees (solid line); AGA – above girdling area (dashed line); BGA – below girdling area (dotted line). DOY – day of the year (70: March 11, 120: May 30, 170: June 19, 220: August 8, 270: September 27, 320: November 16). Solid vertical line – date of girdling.
| Table 2. Timings of phloem cell differentiation phases in six control and six girdled (above girdling) trees (2013 and 2014). | |||||||
| 2013 | 2014 | ||||||
| Parameters (DOY) | Control | AGA | K–W test | Control | AGA | K–W test | |
| EP | 112 ± 4 | 114 ± 3 | 0.847 | 88 ± 4 | 95 ± 4 | 0.014 | |
| LP | 144 ± 5 | 148 ± 7 | 0.473 | 129 ± 8 | 122 ± 6 | 0.107 | |
| CLP | 232 ± 16 | 214 ± 17 | 0.089 | 181 ± 14 | 174 ± 4 | 0.108 | |
| EP duration (days) | 41 ± 5 | 43 ± 11 | 0.737 | 47 ± 10 | 35 ± 9 | 0.038 | |
| LP duration (days) | 88 ± 17 | 67 ± 16 | 0.075 | 51 ± 14 | 52 ± 8 | 0.924 | |
| Total duration (days) | 128 ± 16 | 110 ± 17 | 0.061 | 98 ± 13 | 87 ± 4 | 0.059 | |
| P-values for Kruskal–Wallis test (H0 – Medians of all groups are equal, if p < alpha (0.05) > rejecting H0). DOY – day of year; Control – control trees; AGA – above girdling area; K–W test – results (p-values) of Kruskal–Wallis test; EP – onset of early phloem formation; LP – onset of late phloem formation and cessation of EP; CLP – cessation of LP. Bold – statistically significant difference (alpha = 0.05). | |||||||
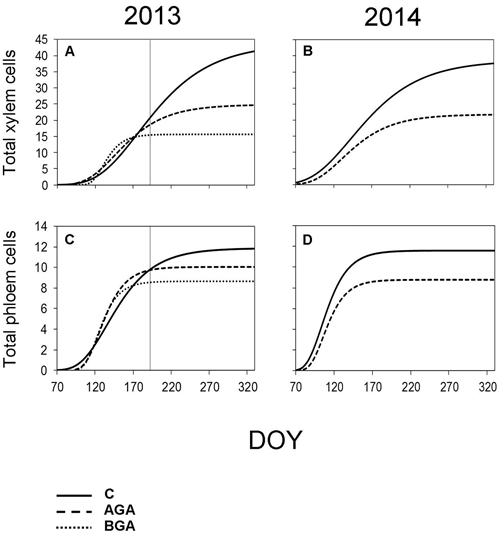
Fig. 7. Dynamics of xylem and phloem formation fitted by the Gompertz function during the 2013 and 2014 growing seasons. S-shaped curve – Gompertz function. C – control trees (solid line); AGA – above girdling area (dashed line); BGA – below girdling area (dotted line). DOY – day of the year (70: March 11, 120: May 30, 170: June 19, 220: August 8, 270: September 27, 320: November 16). Solid vertical line – date of girdling.
| Table 3. Dynamics of xylem formation from the parameters of the Gompertz function during 2013 and 2014 in six control and six girdled trees (above, below). | |||||||
| 2013 | 2014 | ||||||
| Control | Girdled | Control | Girdled | ||||
| Parameters | AGA | BGA | AGA | BGA | |||
| Final cell number | 43.71 | 24.84 | 15.63 | 38.60 | 21.80 | - | |
| Daily cell rate of xylem formation | 0.21 | 0.17 | - | 0.19 | 0.15 | - | |
| Maximum daily cell rate | 0.30 | 0.24 | - | 0.28 | 0.22 | - | |
| Day of maximum daily cell rate (DOY) | 176.57 | 145.65 | - | 142.34 | 130.76 | - | |
| Duration of xylem formation (days) | 212.17 | 149.41 | - | 202.74 | 145.04 | - | |
| AGA – above girdling area; BGA – below girdling area. | |||||||
| Table 4. Dynamics of phloem formation from the parameters of the Gompertz function during 2013 and 2014 in six control and six girdled trees (above, below). | |||||||
| 2013 | 2014 | ||||||
| Control | Girdled | Control | Girdled | ||||
| Parameters | AGA | BGA | AGA | BGA | |||
| Final cell number | 11.87 | 10.05 | 8.65 | 11.59 | 8.78 | - | |
| Daily cell rate of phloem formation | 0.09 | 0.13 | - | 0.15 | 0.13 | - | |
| Maximum daily cell rate | 0.13 | 0.19 | - | 0.22 | 0.19 | - | |
| Day of maximum daily cell rate (DOY) | 135.26 | 125.53 | - | 103.69 | 105.64 | - | |
| Duration of phloem formation (days) | 138.12 | 76.80 | - | 77.12 | 67.30 | - | |
| AGA – above girdling area; BGA – below girdling area. | |||||||