| Table 1. Mean characteristics of the experimental stands at the onset of the experiment and the length of the study periods. Stand groups: Sapling stand stage (SS; H0 < 8 m), energy wood thinning stage (EW; 8 m < H0 < 11 m), and pulpwood thinning stage (PW; H0 > 12 m). Exp #: Code of the stands in Luke’s data archive. View in new window/tab. |
| Table 2. The alternative harvesting methods and the structure of the resulting removals (merchantable wood). | |||
| Harvesting method | Removal | Pulpwood component | Energy wood component |
| A. Pulpwood harvesting | Pulpwood | Pulpwood part of the stem 1) | – |
| B. Integrated harvesting | Pulpwood + energy wood as delimbed stems | Pulpwood part of the stem 1) | Top waste 2) + small stems 3) − tops 4) |
| C. Integrated harvesting | Pulpwood + energy wood as whole-tree | Pulpwood part of the stem 1) | Top waste 2) + small stems 3) + branches − branch waste 5) |
| D. Energy wood harvesting | Energy wood as delimbed stems | – | Large stems + top waste 2) + small stems 3) − tops 4) |
| E. Energy wood harvesting | Energy wood as whole-tree | – | Large stems + small stems 3) + branches − branch waste 5) |
| F. Advanced energy wood harvesting 6) | Energy wood as whole-tree | – | Large stems + small stems 3) + branches − branch waste 5) |
| 1) minimum top diameter of the pulpwood poles was 6.5 cm. 2) top waste = the part of the stem which is not pulpwood size. 3) small stems = stems smaller than pulpwood stems, diameter at breast height (d1.3) over 3.5 cm. 4) tops = the thinnest part of the stems cut away (diameter smaller than ~2 cm). 5) branch waste = branches that were dropped at the cutting area (see text for estimation). 6) for SS and EW stands. Similar to method E, but harvested by an accumulating felling head that is designed to be more efficient than regular multi-tree felling heads in dense stands with small stems (Jylhä and Bergström 2016) | |||
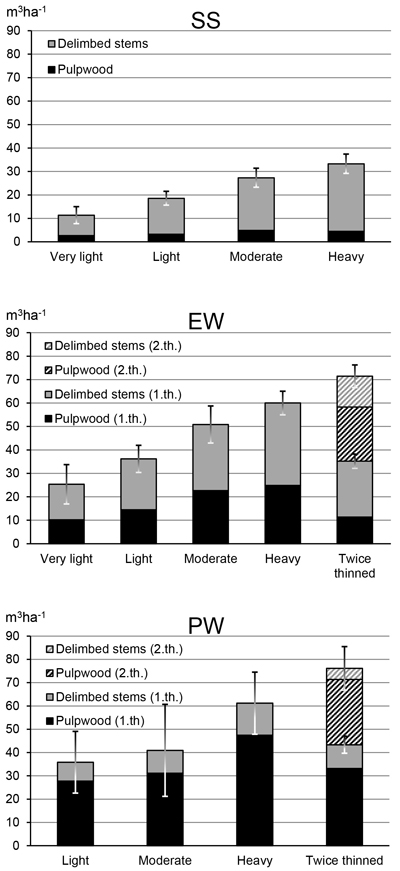
Fig. 1. Thinning removals (m3 ha–1) in stand groups SS (sapling stand stage), EW (energy-wood thinning stage), and PW (pulpwood thinning stage) comprising of pulpwood and energy wood as delimbed stems. In SS stands, the first-thinning removal was computational and thus ignored later when calculating total removals and profitability. Error bars are standard errors of means for the total first-thinning removal and for the removal of two thinnings when the second thinning was also carried out.
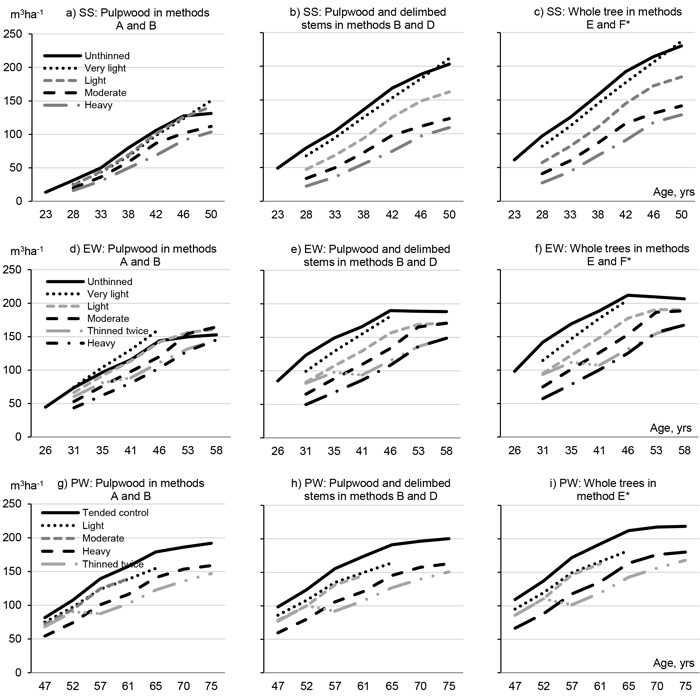
Fig. 2. Estimates for final-cutting removals (m3 ha–1) as a function of stand age (yrs). Lines describe different intensities of thinnings done at the onset of the experiments. Letters A–F refer to different harvesting methods (described in Table 2). Top panels: sapling-stage stands (SS), middle panels: energy wood thinning stage stands (EW), lowest panels: pulpwood thinning stage stands (PW). *) = Method C is not shown, because the pulpwood + whole-tree energy wood components followed the same trends but with slightly lower values compared to methods E and F (on average 2.5 m3 ha–1).
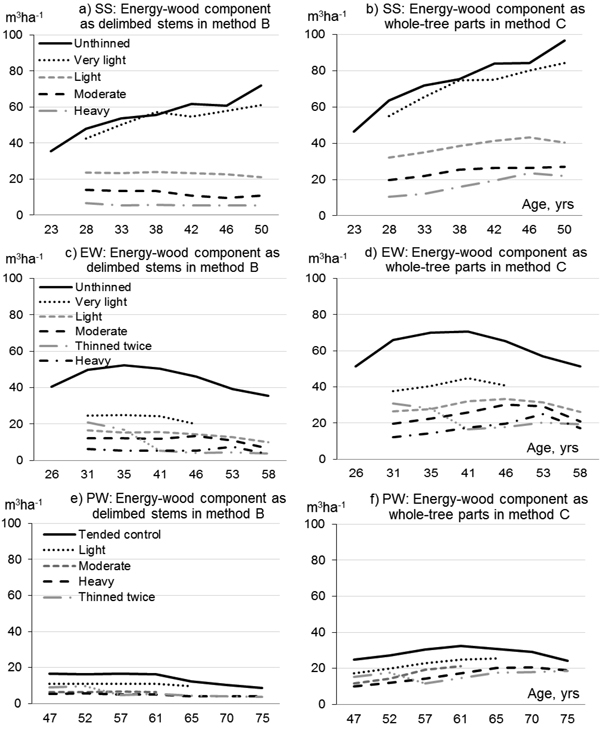
Fig. 3. Energy-wood components of the estimated final-cutting removals (m3 ha–1) as a function of stand age (yrs) in integrated harvesting methods B (left) and C (right) (method descriptions are in Table 2). Lines describe the different intensities of thinnings done at the onset of the experiments. Top panels: sapling-stage stands (SS), middle panels: energy wood thinning stage stands (EW), lowest panels: pulpwood thinning stage stands (PW).
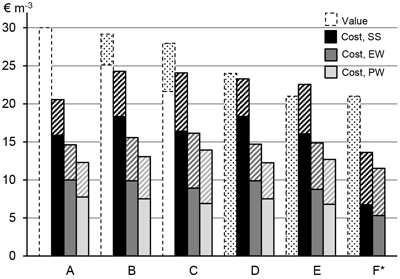
Fig. 4. Average value of final-cutting removals (€ m–3 at the roadside) and cost of harvesting (€ m–3) for each harvesting methods A–F at 20 years after first thinning. The selected time point represents average ages of 42, 46, and 65 years in stand groups SS (sapling stand stage), EW (energy wood thinning stage), and PW (pulpwood thinning stage), respectively. Value-bars are divided by proportions of pulpwood (blank part) and energy wood (dashed part). Cost-bars are divided by proportions of cutting (filled part) and haulage (dashed part) costs.
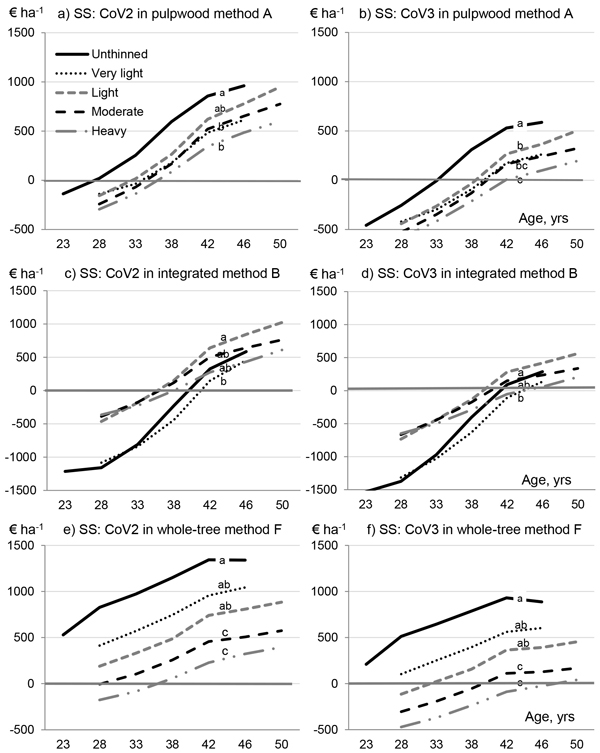
Fig. 5. Profitability, expressed as combined values (CoV, € ha–1) of net present value of the ongoing birch rotation and discounted bare land value of future spruce rotations, as a function of stand age (yrs) for sapling-stage (SS) stands. Lines describe the different thinning intensities and different panels show the harvesting methods A (top), B (middle), and F (bottom) (method descriptions are in Table 2). Discounting was done to the onset of the experiment with interest rates 2% (CoV2, left) and 3% (CoV3, right). Thinning intensities marked with the same letter were not significantly different within the harvesting method and interest rate (p > 0.05).
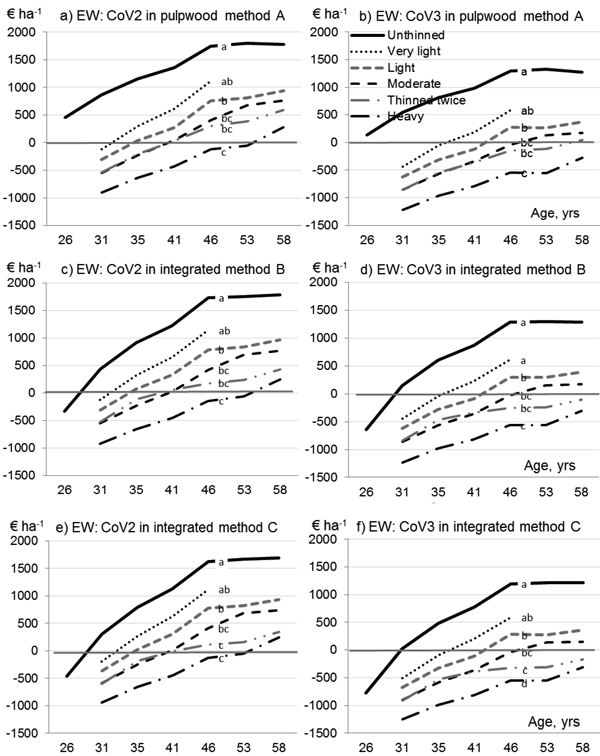
Fig. 6. Profitability, expressed as combined values (CoV, € ha–1) of net present value of the ongoing birch rotation and discounted bare land value of future spruce rotations, as a function of stand age (yrs) for energy wood thinning stage (EW) stands. Lines describe the different thinning intensities and different panels show the harvesting methods A (top), B (middle), and C (bottom) (method descriptions are in Table 2). Discounting was done to the onset of the experiment with interest rates 2% (CoV2, left) and 3% (CoV3, right). Thinning intensities marked with the same letter were not significantly different within the harvesting method and interest rate (p > 0.05).
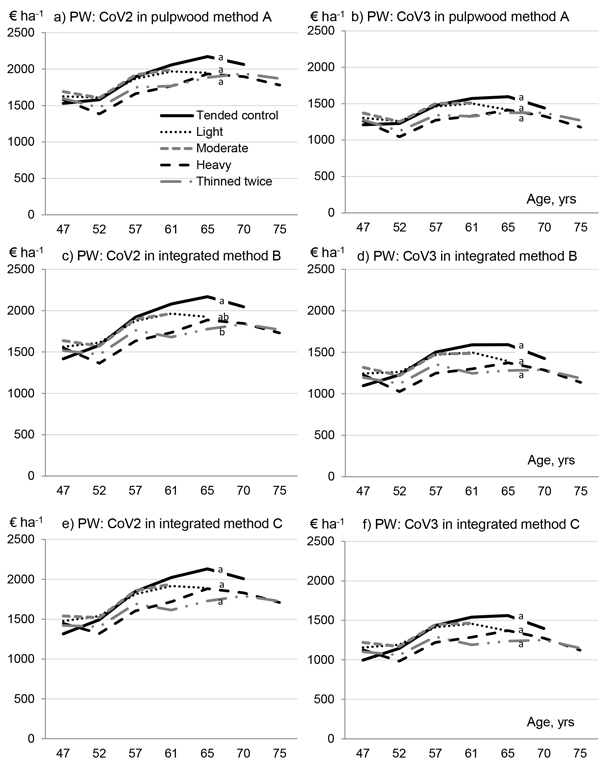
Fig. 7. Profitability, expressed as combined values (CoV, € ha–1) of net present value of the ongoing birch rotation and discounted bare land value of future spruce rotations, as a function of stand age (yrs) for pulpwood thinning stage (PW) stands. Lines describe the different thinning intensities and different panels show the harvesting methods A (top), B (middle), and C (bottom) (method descriptions are in Table 2). Discounting was done to the onset of the experiment with interest rates 2% (CoV2, left) and 3% (CoV3, right). Thinning intensities marked with the same letter were not significantly different within the harvesting method and interest rate (p > 0.05).
| Table 3. Mixed model (Eq. 5) parameters concerning the whole data. Independent variables CoV2 and CoV3 when growing stands 20 years after the first thinning. | ||||
| CoV2: coeff. | CoV2: sig. | CoV3: coeff. | CoV3: sig. | |
| Intercept (a) | –6728.3 | <0.01 | –6180.2 | 0.00 |
| Twice thinned (b5) | 79.8 | 0.98 | –717.9 | 0.83 |
| Heavy (b4) | 4543.2 | <0.01 | 4436.9 | <0.01 |
| Moderate (b3) | 1850.9 | 0.06 | 1776.2 | 0.06 |
| Light (b2) | 1426.9 | 0.15 | 1467.9 | 0.11 |
| Very light (b1) | 1995.7 | 0.11 | 1858.2 | 0.11 |
| Unthinned (b0) | 0.0 | 0.0 | ||
| Covariates: | ||||
| H50 (c) | 133.3 | <0.01 | 113.0 | <0.01 |
| Hdom (d) | 1044.0 | <0.01 | 944.8 | <0.01 |
| Hdom2 (e) | –40.4 | <0.01 | –37.3 | <0.01 |
| Interactions: | ||||
| Twice * Hdom (f5) | –365.0 | 0.53 | –245.4 | 0.65 |
| Heavy * Hdom (f4) | –1121.6 | <0.01 | –1108.6 | <0.01 |
| Moderate * Hdom (f3) | –492.6 | 0.02 | –489.1 | 0.02 |
| Light * Hdom (f2) | –387.7 | 0.07 | –407.9 | 0.04 |
| Very light * Hdom (f1) | –556.4 | 0.06 | –520.9 | 0.06 |
| Unthinned * Hdom(f0) | 0.0 | 0.0 | ||
| Twice * Hdom2 (g5) | 22.8 | 0.34 | 18.7 | 0.40 |
| Heavy * Hdom2 (g4) | 52.9 | <0.01 | 52.9 | <0.01 |
| Moderate * Hdom2 (g3) | 21.8 | 0.06 | 22.3 | 0.04 |
| Light* Hdom2 (g2) | 17.6 | 0.11 | 19.1 | 0.06 |
| Very light * Hdom2 (g1) | 29.2 | 0.08 | 27.0 | 0.09 |
| Unthinned * Hdom2 (g0) | 0.0 | 0.0 | ||
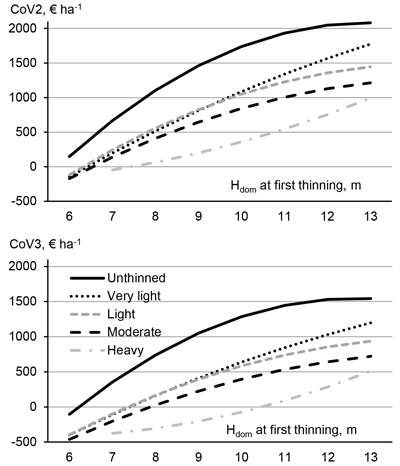
Fig. 8. Expected combined values (CoV2 and CoV3, € ha–1) at 20 years from the onset of the experiments obtained with harvesting method A (see Table 2) for stands representing different dominant heights (Hdom, m, at the onset of the experiments) and overall mean site index (H50 = 15.5) (Eq. 5). Lines describe different thinning intensities.