| Table 1. Classification of extratrion roads based on the estimated number of forwarder passages. |
| Road class | Number of passages |
| (1) Small strip road | 1–2 |
| (2) Strip road | 3–5 |
| (3) Base road | 6–10 |
| (4) Main base road | >10 |
| Table 2. Soil bearing capacity classification based on soil type. |
| Soil bearing capacity class | Soil type |
| (1) High bearing capacity | Bedrock, stony soils, gravely till soils |
| (2) Medium bearing capacity | Sand and gravel sediments, sandy till soils |
| (3) Low bearing capacity | Peat soils, clay and silt sediments, clayey silt and silty till soils |
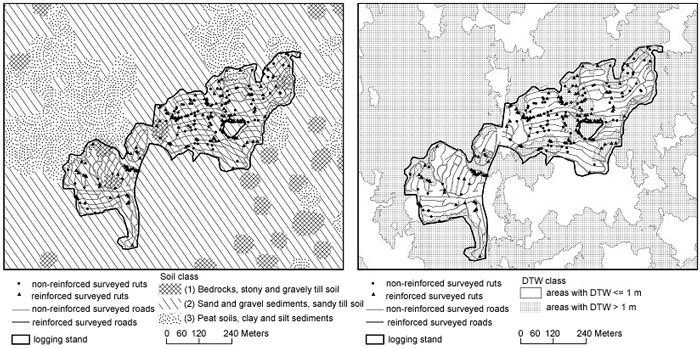
Fig. 1. One of the 16 logging sites with surveyed roads and ruts over soil map (left), and the reclassified cartographic depth-to-water (DTW) map (right). View larger in new window/tab.
| Table 3. Summary of the surveyed sites and extraction roads trafficked by forwarders. Areas with depth-to-water (DTW) <= 1 m were supposed to be more vulnerable for rut formations at trafficking. |
| Object no | Area, (ha) | Share of area with soil type of different bearing capacity, (%) | Share of area with DTW <= 1 m, (%) | Total length of roads, (m) | Share of roads with ruts deeper than 10 cm, (%) |
| low | medium | high |
| 1 | 39.27 | 13 | 73 | 14 | 14 | 23062 | 28 |
| 2 | 20.15 | 7 | 86 | 7 | 7 | 12210 | 8 |
| 3 | 4.87 | 11 | 65 | 25 | 25 | 3392 | 28 |
| 4 | 2.97 | 1 | 52 | 48 | 48 | 1641 | 20 |
| 5 | 1.86 | 0 | 64 | 36 | 36 | 1038 | 25 |
| 6 | 2.65 | 0 | 88 | 12 | 12 | 1624 | 18 |
| 7 | 15.61 | 2 | 71 | 27 | 27 | 8900 | 21 |
| 8 | 0.85 | 12 | 88 | 0 | 0 | 410 | 5 |
| 9 | 5.92 | 2 | 75 | 22 | 22 | 3300 | 7 |
| 10 | 3.94 | 0 | 65 | 35 | 35 | 2249 | 6 |
| 11 | 18.15 | 4 | 79 | 17 | 17 | 10042 | 7 |
| 12 | 7.99 | 0 | 79 | 21 | 21 | 4258 | 2 |
| 13 | 18.38 | 5 | 70 | 25 | 25 | 9833 | 1 |
| 14 | 7.08 | 0 | 97 | 3 | 3 | 4171 | 0 |
| 15 | 16.26 | 19 | 77 | 4 | 4 | 8811 | 2 |
| 16 | 12.19 | 0 | 98 | 2 | 2 | 4836 | 3 |
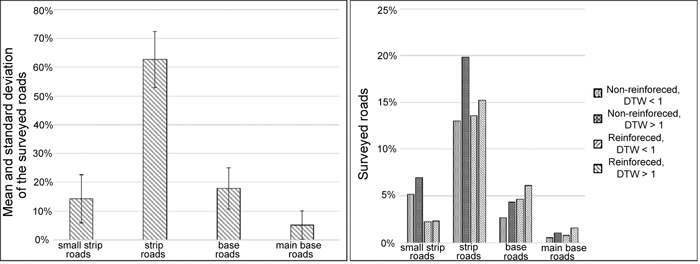
Fig. 2. Mean value and standard deviation of the surveyed roads on 16 logging sites by road class: (1) small strip road with 1–2 passages, (2) strip road with 3–5 passages, (3) base road with 6–10 passages and (4) main base road with >10 passages (left); Distribution of surveyed roads by road class and the cartographic depth-to-water (DTW), (right).
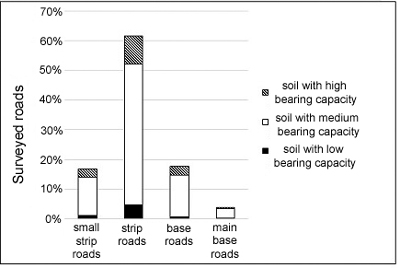
Fig. 3. Distribution of the surveyed roads by road class and soil type.
| Table 4. Statistical analysis of share of roads with ruts, and explanatory variables: road class, cartographic depth-to-water index (DTW), slash reinforcement, soil classes and their interactions. A level of p < 0.05 was chosen to distinguish significant factors. |
| Variable | Degrees of freedom | F-value | p-value |
| Road class | 3 | 13.29 | <0.0001 |
| DTW | 1 | 1.68 | 0.1960 |
| Slash reinforcement | 1 | 0.43 | 0.5144 |
| Soil class | 2 | 12.18 | <0.0001 |
| Road class × DTW | 3 | 0.39 | 0.7613 |
| Road class × Slash reinforcement | 3 | 0.64 | 0.5887 |
| Road class × Soil class | 6 | 1.37 | 0.2266 |
| DTW × Slash reinforcement | 1 | 0.88 | 0.3488 |
| DTW × Soil class | 2 | 0.92 | 0.3986 |
| Slash reinforcement × Soil class | 2 | 0.00 | 0.9977 |
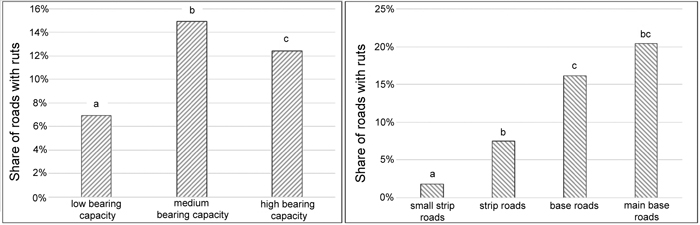
Fig. 4. Share of roads with ruts deeper than 10 cm by soil class (left) and road class (right) in all surveyed sites. Bars with different letters are statistically significant from each other according to the Tukey test.
| Table 5. Analysis of the influence of road class, cartographic depth-to-water (DTW) index class, soil class and slash reinforcement on the share of roads with ruts in the different sites, p-values from the 16 stand-based ANOVAS. A level of p < 0.05 was chosen to distinguish significant factors, cells with * indicate a significant influence and cells ** with are the ones with a near significant influence. View in new window/tab. |