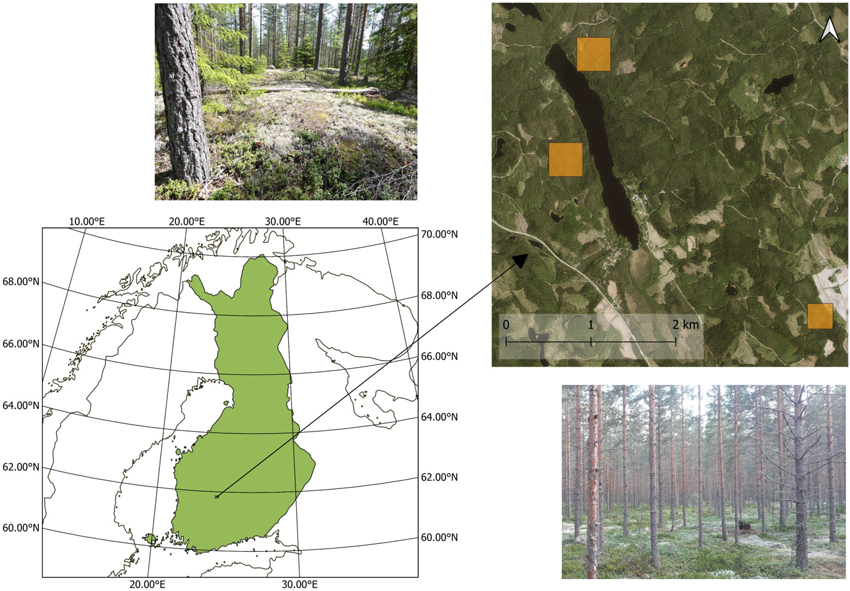
Fig. 1. Location of the study area and photos from two study stands. The in situ plots and flight plots are located within the yellow squares.
| Table 1. Mean and range of percentage cover of ground cover types in the in situ and flight plots. | ||||
| In situ plots | Flight plots | |||
| Mean (%) | Range (%) | Mean (%) | Range (%) | |
| Lichens | 30.9 | 0–90 | 30.7 | 0–82 |
| Vascular plants | 30.7 | 0–85 | 33.9 | 0–72 |
| Vaccinium vitis-idaea | 23.5 | 0–60 | 22.2 | 0–48 |
| Vaccinium myrtillus | 0.7 | 0–39 | 2.7 | 0–27 |
| Calluna vulgaris | 6.4 | 0–48 | 8.6 | 0–52 |
| Other vascular plants | 0.2 | 0–8 | 0.4 | 0–3 |
| Mosses | 13.3 | 0–42 | 13.4 | 0–42 |
| Litter | 25 | 6–59 | 21.8 | 6–41 |
| Stone | 0 | 0 | 0.2 | 0–4 |
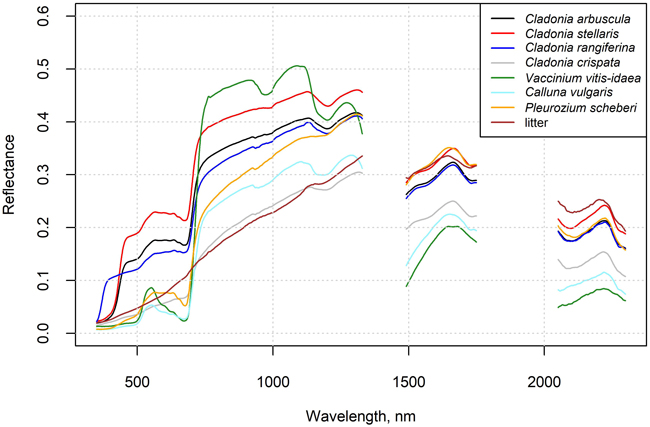
Fig 2. In situ measured reflectance spectra of selected species and litter. Data are provided in the Supplementary file S2.
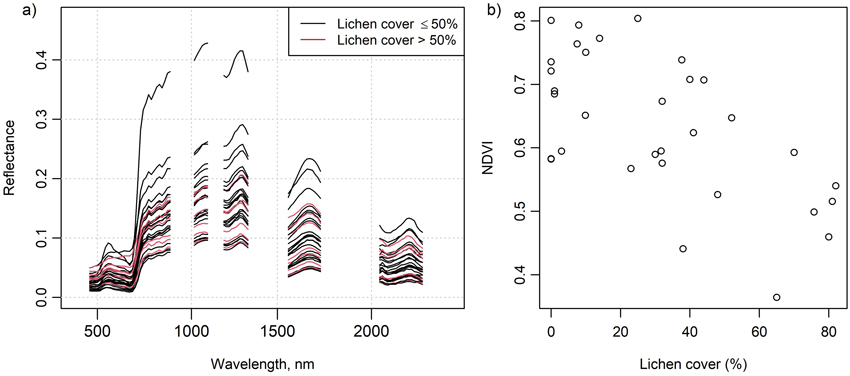
Fig. 3. Figure on the left (a) shows the airborne spectra of the 32 flight plots. Red color indicates a greater than 50% lichen cover in a plot. Figure on the right (b) shows normalized difference vegetation index (NDVI) calculated from the airborne spectra plotted against percentage lichen cover in the flight plots. NDVI was calculated using spectral bands centered at 667 nm and 838 nm.
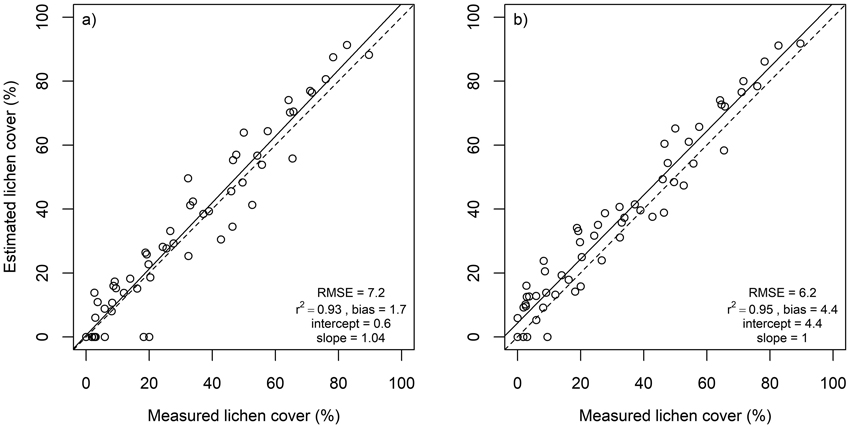
Fig. 4. Estimated versus measured lichen cover in in situ plots as well as root mean square error (RMSE), coefficient of determination (r2), intercept and slope of linear regression. Dashed lines represent 1:1 line. Results derived using a) all spectral bands (n = 1488), b) spectral bands at 400, 492, 670, 760, 875, 1716, 2051 and 2081 nm.
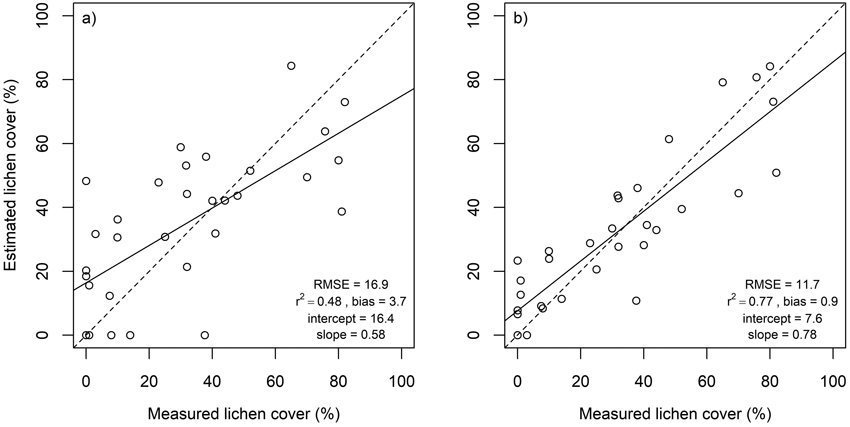
Fig. 5. Estimated versus measured lichen cover in flight plots as well as root mean square error (RMSE), coefficient of determination (r2), intercept and slope of linear regression. Dashed lines represent 1:1 line. Results derived using a) all spectral bands (n = 77), and b) spectral bands at 496, 695, 767, 867 and 1273 nm.
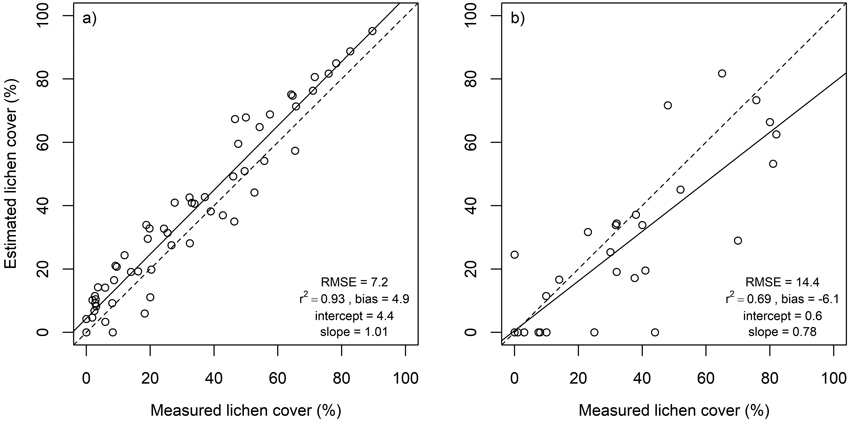
Fig. 6. Estimated versus measured lichen cover as well as root mean square error (RMSE), coefficient of determination (r2), intercept and slope of the linear regression in in situ plots (a) and in flight plots (b) when their spectra were resampled to spectral resolution of Sentinel-2. Dashed lines represent 1:1 line.
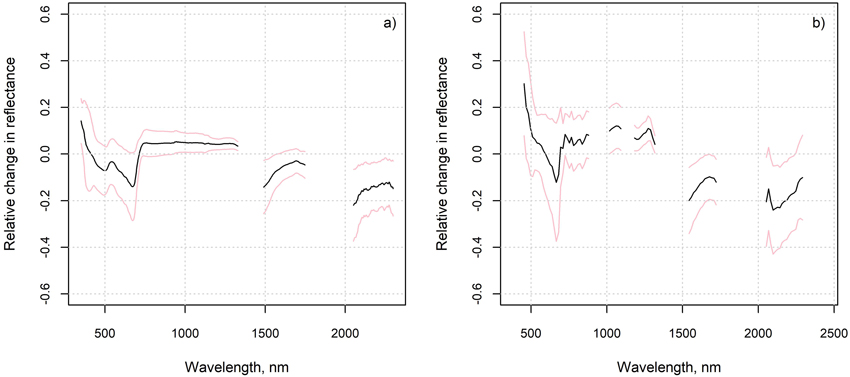
Fig. 7. Average of the relative changes from measured to “optimal” spectra, and their standard deviation, in a) in situ plots and b) flight plots.
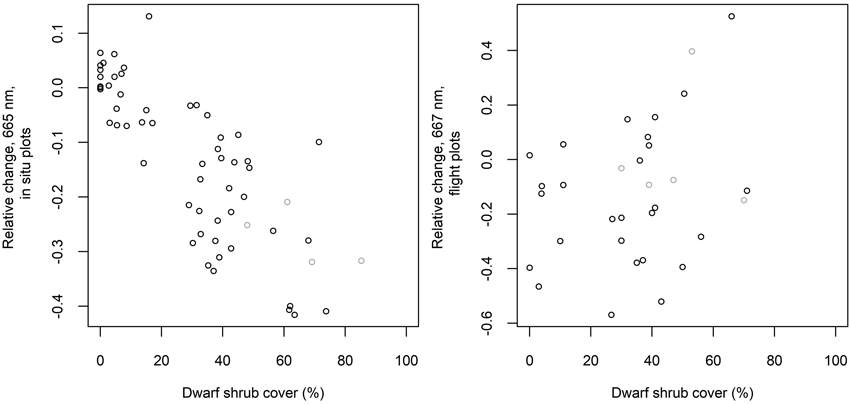
Fig. 8. Relative change from measured to “optimal” reflectance in spectral band 665 nm (in situ plots) or 667 nm (flight plots) versus measured cover of dwarf shrubs. Dwarf shrubs include Vaccinium vitis-idaea, Calluna vulgaris and Vaccinium myrtillus. Grey circles indicate plots with no lichen.
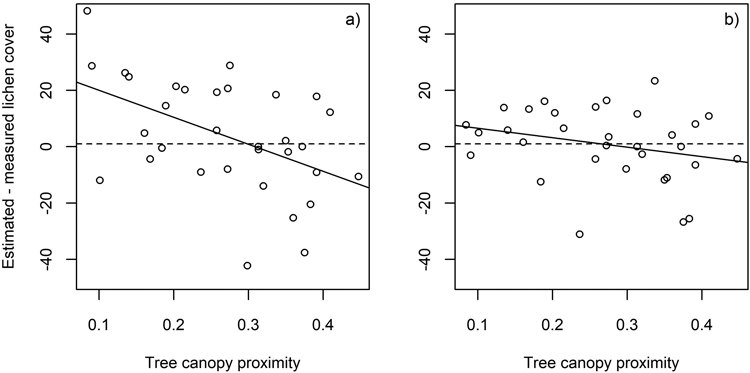
Fig. 9. The difference between estimated and measured lichen cover in the flight plots plotted against tree canopy proximity. Results derived using a) all spectral bands (n = 77) (r2 = 0.24), and b) spectral bands at 496, 695, 767, 867 and 1273 nm (r2 = 0.07).