| Table 1. The parameter values for the model log(y) = β0 + βx1 + βx2 + βx3 + βx4 + βx5 + βx6 + βx7 + ε used for simulating the “true” values of volume for the simulation experiment. | |||
| Estimate | Std. Error | T Value | |
| Intercept | 1.537 | 0.142 | 10.86 |
| Hmax_f | 0.024 | 0.007 | 3.17 |
| Hq55_f | 0.028 | 0.010 | 2.80 |
| H90_f | 0.035 | 0.013 | 2.73 |
| Pveg_f | 0.010 | 0.001 | 18.33 |
| Hq20_l | 0.025 | 0.004 | 6.70 |
| Imean | –0.050 | 0.008 | –6.53 |
| Csm_sumEnt | 0.367 | 0.021 | 17.69 |
| The names of the variables are: The maximum height of the points, Height at which 55% and 90% of vegetation points are accumulated (m), Proportion of vegetation points relative to all points (%, first echo), Proportion of points having cumulated at 20% of the height from all points (%, last echo), Average intensity, SumEntropy (Haralick) of canopy surface model. | |||
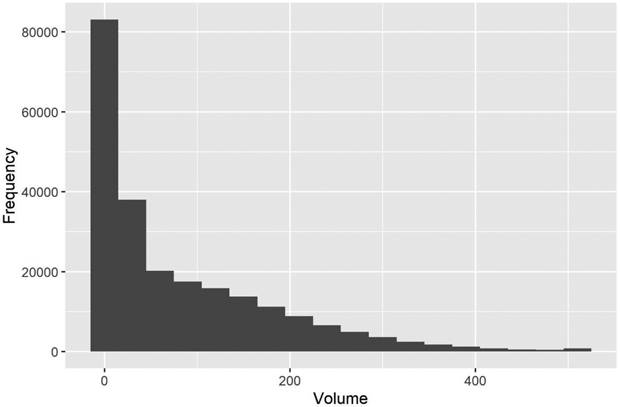
Fig. 1. The distribution of simulated “true” volumes (m3 ha–1) in the test area grid. The values > 500 m3 are all in the last class.
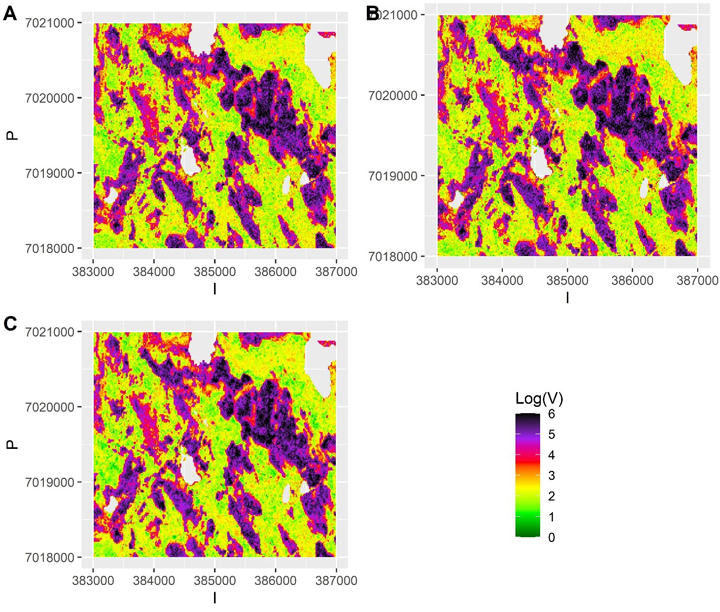
Fig. 2. The simulated “true” values of logarithm of volume in small part of the test data grid assuming a) independent errors b) autocorrelated errors with a long range (337 m) and large nugget effect and c) autocorrelated errors with no nugget effect and a short range (23 m). The scale is truncated at value 6.
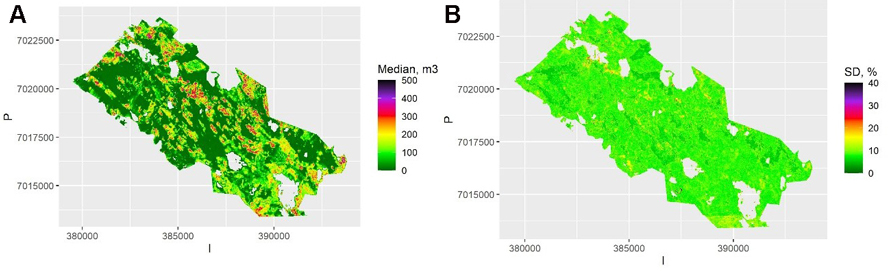
Fig. 3. A) The predicted median volumes for each pixel and averaged over the samples using Quantile Random Forest (QRF) algorithm. The scale is truncated at value 500 m3. B) The relative between-sample standard error of estimates calculated with QRF. The scale is truncated at value 40%. View larger in new window/tab.
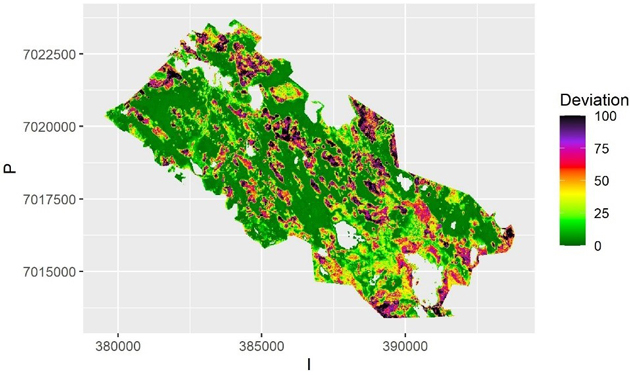
Fig. 4. The average deviation from predicted value of volume over the samples for each pixel using Quantile Random Forest algorithm. The deviation is calculated as half of the interval between the 2.5% and 97.5% quantiles. The scale is truncated at value 100 m3.
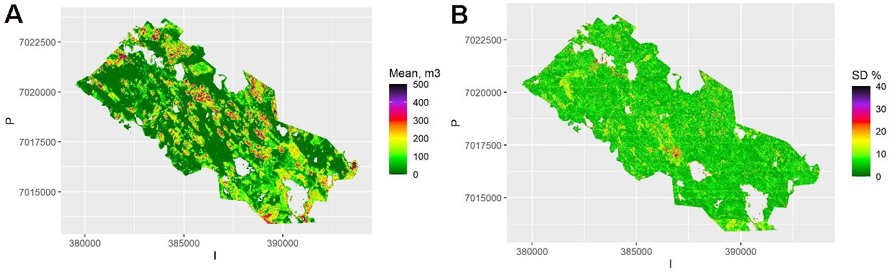
Fig. 5. A) The mean volume prediction for each pixel averaged over the samples using kriging. The scale is truncated at value 500 m3. B) The relative between-sample standard error based on kriging. The scale is truncated at value 40%. View larger in new window/tab.
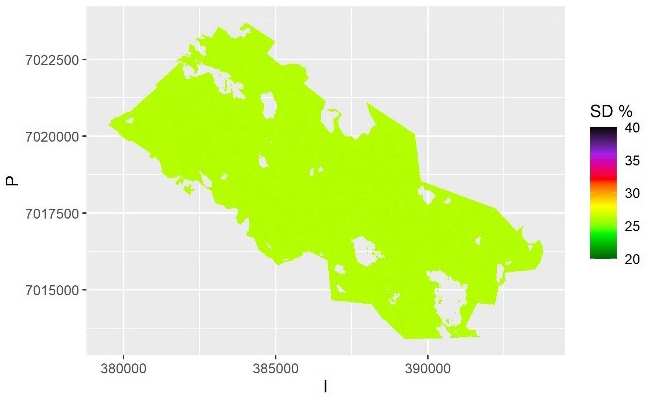
Fig. 6. The relative within-sample standard error of volume predictions for each pixel based on kriging and averaged over the samples. The scale is truncated at value 40%.
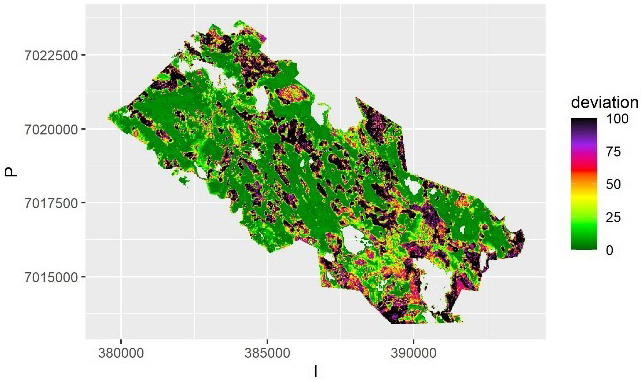
Fig. 7. The average deviation from the predicted value of volume in each pixel over the samples using kriging. The deviation is calculated as half of the prediction interval. The scale is truncated at value 100 m3.