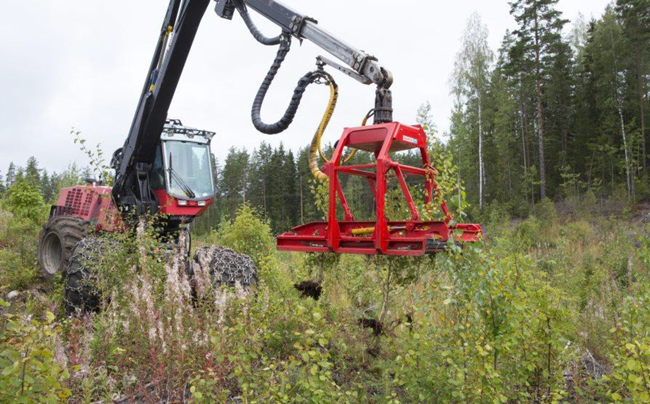
Fig. 1. Uprooting device connected to a harvester boom. Photo: Erkki Oksanen, Luke.
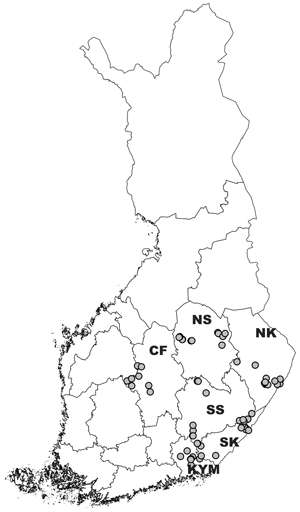
Fig. 2. Location of the uprooting sites in Finland. Regions: SK = South Karelia, SS = Southern Savonia, CF = Central Finland, KYM = Kymenlaakso, NK = North Karelia, NS = Northern Savonia.
| Table 1. The number of uprooted sites and sample plots in different regions and uprooting years inventoried in autumn 2017. | |||||||
| Region* | |||||||
| SK | SS | CF | KYM | NK | NS | Total | |
| Number of uprooted sites | 12 | 11 | 8 | 12 | 11 | 12 | 66 |
| Number of sample plots | 194 | 182 | 154 | 202 | 199 | 196 | 1127 |
| Uprooted in 2012 | 52 | 61 | 44 | 64 | 78 | 58 | 357 |
| Uprooted in 2013 | 74 | 74 | 72 | 67 | 74 | 70 | 431 |
| Uprooted in 2014 | 68 | 47 | 38 | 71 | 47 | 68 | 339 |
| * SK = South Karelia, SS = Southern Savonia, CF = Central Finland, KYM = Kymenlaakso, NK = North Karelia, NS = Northern Savonia | |||||||
| Table 2. The main characteristics on the 20 m2 sample plots inventoried on 66 uprooted stands (N = 1127). | ||||
| Continuous variable | Mean | Std. dev. | Range | |
| No. of crop-trees per 20 m2 | 3.9 | 1.2 | 1–6 | |
| No. of competing trees per 20 m2 | 12.9 | 11.1 | 0–80 | |
| No. of competing birches per 20 m2 | 7.6 | 9.7 | 0–80 | |
| No. of freely growing crop-tree spruces per 20 m2 | 2.2 | 1.3 | 0–6 | |
| Proportion of freely growing crop-tree spruces, % | 65.0 | 33.1 | 0–100 | |
| Mean height of crop-tree spruces, cm | 277 | 84 | 60–580 | |
| Mean height of competing trees, cm | 183 | 52 | 100–450 | |
| Time from planting to uprooting in years | 4.8 | 0.9 | 2–7 | |
| Time from uprooting to measurement in years | 4.2 | 0.8 | 3–5 | |
| Mean height of crop-tree spruces at uprooting, cm | 114 | 41 | 25–272 | |
| Topographic wetness index (TWI) | 7.1 | 1.4 | 4.3–14.7 | |
| Thickness of humus layer, cm | 3.4 | 1.1 | 1–13 | |
| Categorical variables | N | % | ||
| Stump harvesting | No | 634 | 56 | |
| Yes | 493 | 44 | ||
| Soil preparation method | Spot mounding | 1064 | 94 | |
| Mounding with ditches | 49 | 4 | ||
| Disc trenching | 14 | 1 | ||
| Site fertility | Rich (Oxalis-Myrtillus type) | 165 | 15 | |
| Medium (Myrtillus type) | 739 | 65 | ||
| Sub-dry (Vaccinium type) | 223 | 20 | ||
| Soil texture | Coarse | 133 | 11 | |
| Medium | 954 | 85 | ||
| Fine | 20 | 2 | ||
| Peat | 20 | 2 | ||
| Ground moisture a | Sub-dry | 611 | 54 | |
| Fresh | 310 | 28 | ||
| Moist | 206 | 18 | ||
| a Ground moisture: sub-dry, fresh and moist – the cover of sphagnum or haircap mosses ≤1%, 1–10% and >10%, respectively (Tamminen and Mälkönen 1999). | ||||
| Table 3. Parameter estimates and goodness-of-fit statistics of the multi-level quasi-Poisson model (Eq. 1) estimated for the number of birches on the 20-m2 sample plot 3 to 5 years after uprooting. χ2 is the joined Wald χ2 test of the categorical fixed effects (type III test), the degrees of freedom in parentheses. Fitting statistics using only fixed effects and both random and fixed (in parentheses) are given. The modelling data consist of 1127 sample plots. | ||||
| Fixed effects | Estimate | Std err. | t-value | p |
| Intercept | 0.260 | 0.274 | 0.946 | 0.344 |
| Mean height of crop-tree spruces at uprooting, cm | –0.011 | 0.010 | –1.090 | 0.276 |
| Topographic wetness index (TWI) | 0.153 | 0.020 | 7.566 | <0.001 |
| Thickness of humus layer, cm | 0.072 | 0.025 | 2.84 | 0.005 |
| Site fertility (ref. Sub-dry) | χ2 (2) = 45.90 | <0.001 | ||
| Medium | 0.628 | 0.098 | 6.41 | <0.001 |
| Rich | 0.799 | 0.132 | 6.06 | <0.001 |
| Years since uprooting, a (ref. 5 years) | χ2 (2) = 5.31 | 0.070 | ||
| 3 years | –0.348 | 0.183 | –1.90 | 0.064 |
| 4 years | –0.291 | 0.152 | –1.91 | 0.063 |
| Random effects | Variance | |||
| Region (N = 6) | 0.085 | |||
| Municipality (N = 22) | 0.042 | |||
| Uprooted site (N = 66) | 0.202 | |||
| Snowdon’s bias correction ratio | 1.161 | |||
| Pearson correlation (predicted vs measured) | 0.38 | (0.63) | ||
| Proportion of explained variance R2 (%) | 14.2 | (40.1) | ||
| Root mean square error RMSE (birches per 20 m2 | 8.95 | (7.48) | ||
| Relative RMSE (%) | 117.1 | (97.9) | ||
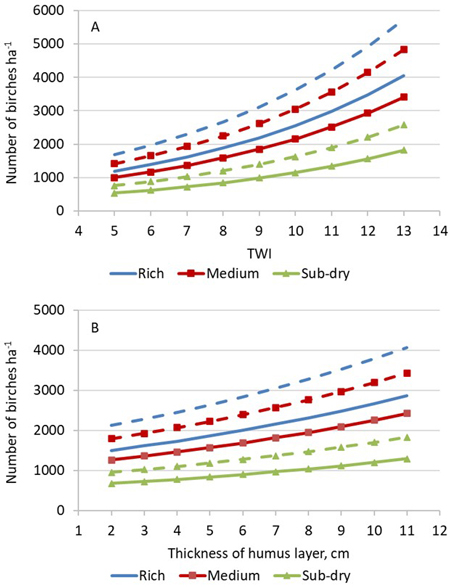
Fig. 3. Predicted number of competing birches ha–1 three (solid lines) and five years (broken lines) after uprooting as a function of (A) topographic wetness index (TWI) and (B) thickness of humus layer on rich, medium and sub-dry site fertility. Other predictors: mean height of crop-tree spruces is 75 cm; thickness of humus layer is 3 cm (A); TWI is 7 (B).
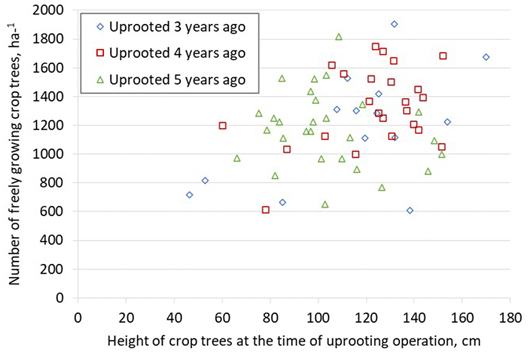
Fig. 4. Number of freely growing crop-tree spruces in the uprooted stands 3–5 years after uprooting as a function of the mean height of crop trees at uprooting operation.
| Table 4. Parameter estimates of the multi-level binomial model (Eq. 2) estimated for the probability of freely growing crop-tree spruce 3 to 5 years after uprooting. χ2 is the joined Wald χ2 test of the categorical fixed effects (type III test), the degrees of freedom in parentheses. The modelling data consist of 3694 crop-tree spruces. | ||||
| Fixed effects | Estimate | Std err. | t-value | p |
| Intercept | –0.154 | 0.352 | –0.44 | 0.661 |
| Height of spruce at uprooting, cm | 0.018 | 0.001 | 15.41 | <0.001 |
| Topographic wetness index | –0.143 | 0.036 | –3.94 | <0.001 |
| Thickness of humus layer, cm | –0.021 | 0.047 | –0.44 | 0.660 |
| Site fertility (ref. Sub-dry) | χ2 (2) = 7.58 | 0.023 | ||
| Medium | –0.253 | 0.123 | –2.05 | 0.040 |
| Rich | –0.494 | 0.184 | –2.69 | 0.007 |
| Years since uprooting, a (ref. 5 years) | χ2 (2) = 2.04 | 0.360 | ||
| 3 years | 0.201 | 0.188 | 1.07 | 0.292 |
| 4 years | 0.203 | 0.157 | 1.29 | 0.203 |
| Random effects | Variance | |||
| Region (N = 6) | 0.077 | |||
| Municipality (22) | <0.001 | |||
| Uprooted site (N = 66) | 0.175 | |||
| Sample plot (N = 1130) | 0.682 | |||
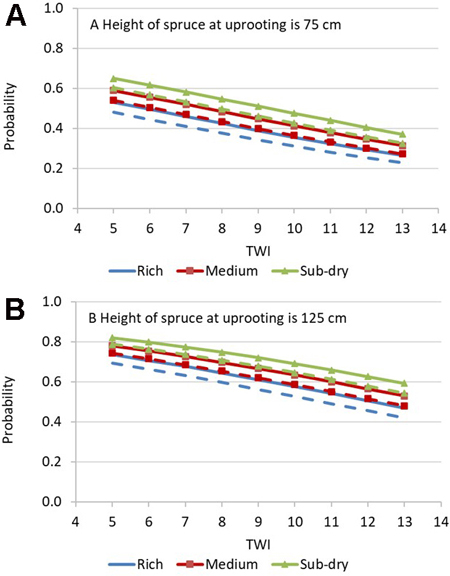
Fig. 5. Predicted probability of freely growing crop-tree spruce 3 to 5 years after uprooting as a function of topographic wetness index (TWI) three (solid lines) and five years (broken lines) after uprooting on rich, medium and sub-dry site fertility when mean height of crop-tree spruces is 75 cm (A) or 125 cm (B). Other predictors: thickness of humus layer is 3 cm.
| Table 5. Accuracy of the classification of the crop-tree spruces as freely growing trees, i.e., the height of competing broadleaves or conifers was not more than 2/3 of the height of the crop-tree spruce. The predicted categories have been calculated using the fixed part of the model (Eq. 2); the classification using both fixed and random effects are given in parentheses. | ||||
| Predicted | ||||
| Observed | Freely growing | Suppressed | Total | Accuracy |
| Freely growing | 1507 (1795) | 918 (630) | 2425 | 62% (74%) |
| Suppressed | 457 (250) | 812 (1019) | 1269 | 64% (80%) |
| Total | 1964 (2045) | 1730 (1649) | 3694 | 63% (76%) |
| Table 6. The main characteristics of the uprooted stands at the first commercial thinning phase (N = 69). The stands were simulated from the inventory moment to the first commercial thinning phase using the Motti simulator. | |||
| Variable | Mean | Std. dev. | Range |
| Stand age, a | 32.6 | 2.0 | 29–38 |
| Stem number of spruces, ha–1 | 1822 | 355 | 901–2758 |
| Stem number of birches, ha–1 | 1125 | 489 | 263–2343 |
| Proportion of birch in stem number, % | 36.5 | 14.1 | 10.2–68.9 |
| Dominant height of spruces, m | 14.4 | 1.4 | 12.3–18.8 |
| Dominant height of birches, m | 15.1 | 1.5 | 12.4–20.9 |
| Stand volume, m3 ha–1 | 182 | 36 | 144–306 |
| Proportion of birch in volume, % | 11.2 | 9.3 | 0.8–46.7 |
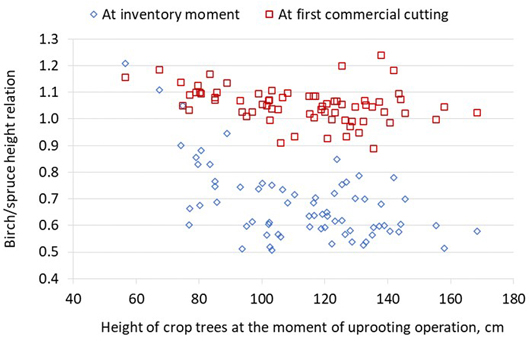
Fig. 6. Ratio of dominant height of birch and spruce in the uprooted stands at the time of the inventory and first commercial thinning (N = 69). The stands were simulated from the inventory moment to the first commercial thinning phase using the Motti simulator.
| Table 7. Parameter estimates and fitting statistics of the multi-level binomial model (Eq. 3) estimated for the proportion of birch of the stand volume in the uprooted stands at the first thinning phase. Fitting statistics using only fixed effects and both random and fixed (in parentheses) are given. The modelling data consist of 69 stands. | ||||
| Fixed effects | Estimate | Std err. | t-value | p |
| Intercept | –0.569 | 0.992 | –0.57 | 0.570 |
| Mean height of crop-tree spruces at uprooting, cm | –0.016 | 0.364 | –4.37 | <0.001 |
| Topographic wetness index | 0.192 | 0.105 | 1.84 | 0.073 |
| Thickness of humus layer, cm | –0.330 | 0.147 | –2.24 | 0.030 |
| Rich site fertility (ref. Medium) | –0.429 | 0.270 | –1.59 | 0.119 |
| Random effects | Variance | |||
| Region (N = 6) | 0.096 | |||
| Municipality (N = 22) | <0.001 | |||
| Snowdon’s bias correction ratio | 1.024 | |||
| Pearson correlation (predicted vs measured) | 0.66 | (0.76) | ||
| Proportion of explained variation R2 (%) | 43.7 | (56.5) | ||
| Root mean square error RMSE (proportion of birch) | 0.07 | (0.06) | ||
| Relative RMSE (%) | 62.3 | (54.8) | ||
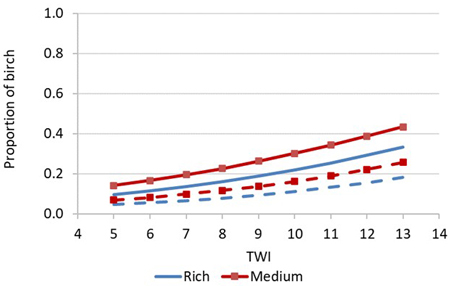
Fig. 7. Predicted proportion of birch of the stand volume in the uprooted stands at the first thinning phase as a function of topographic wetness index (TWI) on rich and medium site fertility when mean height of crop-tree spruces is 75 cm (solid lines) or 125 cm (broken lines). Other predictors: thickness of humus layer is 3 cm.