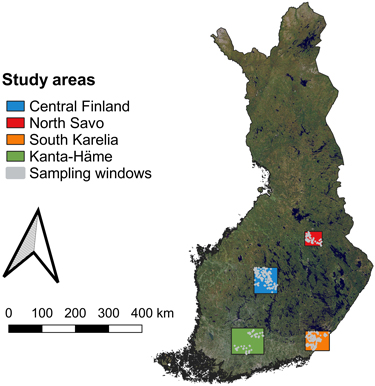
Fig. 1. Geographically dispersed study areas in Finland. The spatial distributions of the used sampling windows (i.e. field plots) within the study areas are also presented. The background raster contained data from the National Land Survey of Finland NLS orthophotos (accessed 4 April 2023 via open Web Map Tile Service, WMTS).
| Table 1. The four rectangular (in WGS 84 / UTM zone 35N, EPSG:32635) study areas named after the regions where they were located in Finland, and the Sentinel-2 MSI Level-2A products used in the study. The sun zenith angle corresponds approximately to the centre of the study area at the time of Sentinel-2 MSI image acquisition. Numbers in the size column are rounded to the closest kilometre. | |||||
| Name | Easting (m) | Size | Sun zenith angle | Sentinel-2 MSI Level-2A products | |
| min | max | ||||
| Northing (m) | |||||
| min | max | ||||
| Central Finland | 373960 | 444960 | 71 km × 79 km | 39.7° | S2A_MSIL2A_20190630T100031_N0212_R122_T35VLK_20190630T125130, S2A_MSIL2A_20190630T100031_N0212_R122_T35VMK_20190630T125130 |
| 6900320 | 6979320 | ||||
| North Savo | 526580 | 579340 | 53 km × 44 km | 40.6° | S2A_MSIL2A_20190614T094031_N0212_R036_T35VNL_20190614T111852 |
| 7043660 | 7087340 | ||||
| South Karelia | 527900 | 600900 | 73 km × 59 km | 38.1° | S2A_MSIL2A_20200615T093041_N0214_R136_T35VNH_20200615T120311 |
| 6728920 | 6787920 | ||||
| Kanta-Häme | 306000 | 403800 | 98 km × 79 km | 38.8° | S2A_MSIL2A_20190710T100031_N0213_R122_T35VLH_20190710T114201 |
| 6718240 | 6797040 | ||||
| Table 2. Forest characteristics of the field plots used for each study area. Plot level mean values for diameter, tree height, basal area, stem volume and stem count are given. The second given value in the brackets is the interquartile range, which is defined as the difference between the 75th and 25th percentiles of the data. Forest reflectances were simulated using forest reflectance and transmittance model FRT for these field plots. | ||||||
| Study area | Number of sampling windows | Mean diameter (cm) | Mean tree height (m) | Mean basal area (m2 ha–1) | Mean stem volume (m3 ha–1) | Mean stem count (ha–1) |
| Central Finland | 430 | 20.4 (7.0) | 17.7 (5.7) | 22.7 (10.7) | 204 (121) | 1028 (550) |
| North Savo | 113 | 13.9 (5.1) | 12.1 (4.0) | 16.5 (8.5) | 105 (71) | 1650 (1022) |
| South Karelia | 257 | 17.3 (8.0) | 15.8 (7.2) | 23.9 (12.5) | 200 (154) | 1542 (903) |
| Kanta-Häme | 127 | 16.7 (8.6) | 15.2 (7.0) | 23.0 (9.7) | 184 (117) | 1664 (1042) |
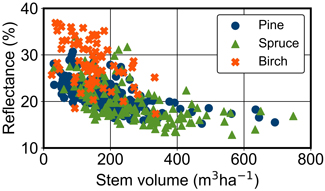
Fig. 2. Stem volumes (m3 ha–1) and Sentinel-2 MSI reflectances of near infrared band (B8, λ = 842 nm) from the Central Finland study area. All sampling windows are presented (N = 430) and the dominant tree species are visualised with the symbols.
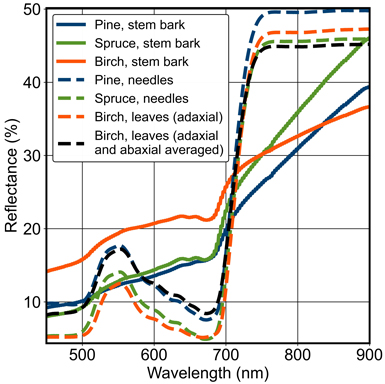
Fig. 3. Stem bark reflectance spectra of pine, spruce and birch used in the study. Examples of foliage reflectance spectra of pine, spruce and birch are also presented from Hyytiälä, Finland. For birch leaves, two different spectra are presented: the upper (adaxial) side and the average of the upper and bottom (abaxial) sides. For the conifers, the two sides were averaged.
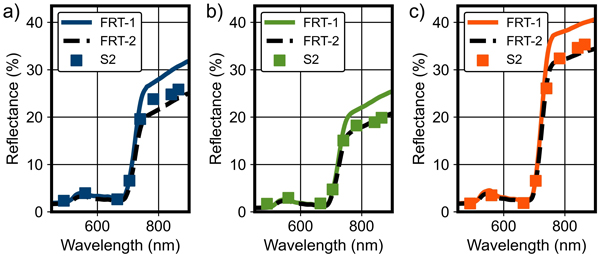
Fig. 4. Examples of forest reflectance simulations by the forest reflectance and transmittance model FRT (FRT-1 and FRT-2) compared with Sentinel-2 (S2) MSI data for pure a) pine, b) spruce and c) birch field plots in Kanta-Häme study area in Finland. Baseline values from Table 3 and adjusted values from Fig. 5 were used as FRT input parameters for FRT-1 and FRT-2, respectively.
| Table 3. Forest reflectance and transmittance model FRT input parameters and their baseline values. The origin of the value is described in the source column. | ||
| Parameter | Baseline values | Source |
| Specific leaf weight (g m–2), SLW | Pine 158, Spruce 200, Birch 57 | As used by Hovi et al. (2016) |
| Branch area to leaf area ratio, BAILAI | Pine 0.18, Spruce 0.18, Birch 0.15 | As used by Rautiainen and Lukeš (2015) and Hovi et al. (2016) |
| Shoot shading coefficient, SSC | Pine 0.59, Spruce 0.64, Birch 1.00 | As used by Rautiainen and Lukeš (2015) and Hovi et al. (2016) |
| Shoot length (m), SHL | Pine 0.10, Spruce 0.05, Birch 0.40 | As used by Hovi et al. (2016) |
| Tree distribution parameter, TDP | 1.2 for all species | As used by Hovi et al. (2016) |
| Tree height (m) | Forest data | Finnish Forest Centre |
| Trunk diameter (cm) | Forest data | Finnish Forest Centre |
| Density (m–2) | Forest data | Finnish Forest Centre |
| Tree species | Forest data | Finnish Forest Centre |
| Dry leaf weight (kg tree–1), DLW | Allometric regression models from literature and forest data | Repola (2008, 2009) and Johansson (1999) |
| Crown radius (m) | Allometric regression models from literature and forest data | Rautiainen et al. (2008) and Jakobsons (1970) |
| Crown length (m) | Allometric regression models from literature and forest data | Rautiainen et al. (2008) and Nilson et al. (1999) |
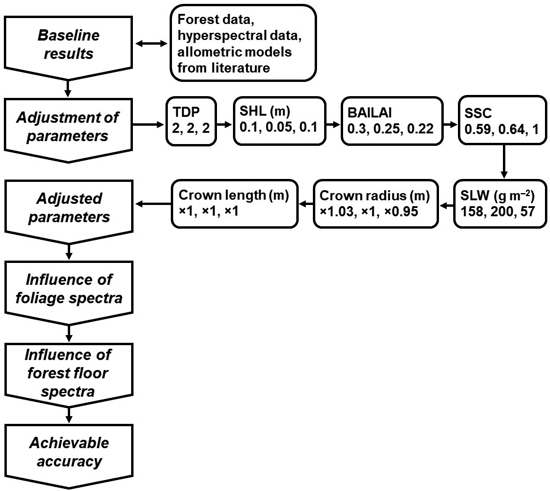
Fig. 5. A flowchart of the analyses including the adjusted FRT input parameter values. The three numbers below the names of the input parameters correspond to the species-specific values for pine, spruce and birch, respectively. For crown radius and length, the numbers are the coefficients used to modify the allometry-based values. See Table 3 for the parameter names and abbreviations.
| Table 4. Estimation accuracy (relative root-mean-square error, rRMSE), correlation (Pearson correlation coefficient, r) and bias (normalised mean bias, NMB) for the simulated forest reflectance in eight Sentinel-2 MSI bands (B2–B8A) with the baseline input parameter values (Table 3). | |||||||||
| Study area | B2 | B3 | B4 | B5 | B6 | B7 | B8 | B8A | |
| Central Finland | r | 0.62 | 0.67 | 0.49 | 0.73 | 0.80 | 0.78 | 0.78 | 0.77 |
| rRMSE (%) | 38.8 | 24.5 | 28.8 | 15.9 | 34.0 | 36.2 | 34.8 | 37.4 | |
| NMB (%) | 31.4 | 16.4 | 7.2 | 5.0 | 29.6 | 31.9 | 30.9 | 33.7 | |
| North Savo | r | 0.58 | 0.50 | 0.61 | 0.61 | 0.77 | 0.76 | 0.75 | 0.74 |
| rRMSE (%) | 21.5 | 17.4 | 31.2 | 18.8 | 25.7 | 29.3 | 30.9 | 30.8 | |
| NMB (%) | 5.4 | –0.1 | –1.9 | –6.8 | 21.8 | 25.6 | 27.7 | 27.7 | |
| South Karelia | r | 0.13 | 0.23 | 0.26 | 0.56 | 0.77 | 0.75 | 0.75 | 0.74 |
| rRMSE (%) | 26.9 | 22.8 | 29.1 | 19.3 | 24.0 | 26.7 | 29.2 | 27.5 | |
| NMB (%) | –15.7 | –9.4 | –15.0 | –11.5 | 17.4 | 20.8 | 24.3 | 22.7 | |
| Kanta-Häme | r | 0.51 | 0.51 | 0.44 | 0.69 | 0.82 | 0.79 | 0.80 | 0.79 |
| rRMSE (%) | 21.1 | 26.1 | 26.4 | 19.1 | 26.4 | 24.5 | 23.4 | 25.1 | |
| NMB (%) | 5.8 | 15.6 | 12.4 | 11.1 | 21.5 | 19.4 | 18.8 | 20.7 | |
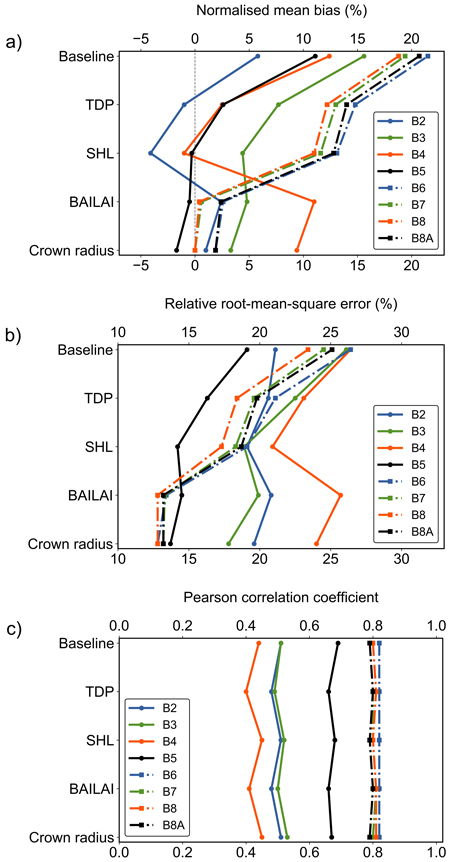
Fig. 6. The change of performance metrics for the baseline scenario and after adjusting the tree distribution parameter (TDP), shoot length (SHL), branch area to leaf area ratio (BAILAI) and crown radius in Kanta-Häme study area in Finland. The presented metrics for eight Sentinel-2 MSI bands (visible region B2–B5 and near infrared region B6–B8A) are a) normalised mean bias, b) relative root-mean-square error and c) Pearson correlation coefficient.
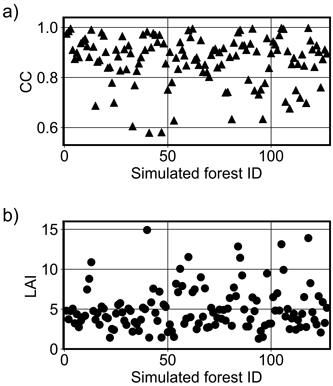
Fig. 7. The values of a) canopy cover (CC) and b) leaf area index (LAI) computed by the forest reflectance and transmittance model FRT for the simulated forests (N = 127) in Kanta-Häme study area in Finland.
| Table 5. Estimation accuracy (relative root-mean-square error, rRMSE), correlation (Pearson correlation coefficient, r) and bias (normalised mean bias, NMB) for the simulated forest reflectance in eight Sentinel-2 MSI bands (B2–B8A) with the adjusted set of input parameter values (Fig. 5). | |||||||||
| Study area | B2 | B3 | B4 | B5 | B6 | B7 | B8 | B8A | |
| Central Finland | r | 0.64 | 0.67 | 0.50 | 0.68 | 0.76 | 0.74 | 0.73 | 0.71 |
| rRMSE (%) | 33.0 | 16.2 | 25.9 | 16.0 | 17.8 | 19.3 | 19.1 | 20.7 | |
| NMB (%) | 25.7 | 4.1 | 4.3 | –7.0 | 8.1 | 9.9 | 9.8 | 12.6 | |
| North Savo | r | 0.58 | 0.49 | 0.60 | 0.57 | 0.74 | 0.73 | 0.71 | 0.70 |
| rRMSE (%) | 19.3 | 19.2 | 29.1 | 24.2 | 13.8 | 15.5 | 16.8 | 16.7 | |
| NMB (%) | 0.3 | –10.2 | –6.5 | –17.4 | 3.3 | 6.5 | 8.9 | 9.3 | |
| South Karelia | r | 0.19 | 0.27 | 0.30 | 0.58 | 0.77 | 0.75 | 0.74 | 0.74 |
| rRMSE (%) | 27.8 | 25.9 | 28.7 | 25.4 | 14.4 | 15.2 | 15.6 | 15.0 | |
| NMB (%) | –19.4 | –19.1 | –17.1 | –21.8 | –1.8 | 1.0 | 4.4 | 3.5 | |
| Kanta-Häme | r | 0.51 | 0.53 | 0.45 | 0.67 | 0.82 | 0.80 | 0.81 | 0.79 |
| rRMSE (%) | 19.6 | 17.8 | 24.0 | 13.7 | 12.8 | 13.2 | 12.8 | 13.2 | |
| NMB (%) | 1.0 | 3.3 | 9.4 | –1.7 | 1.9 | 0.0 | –0.0 | 1.9 | |
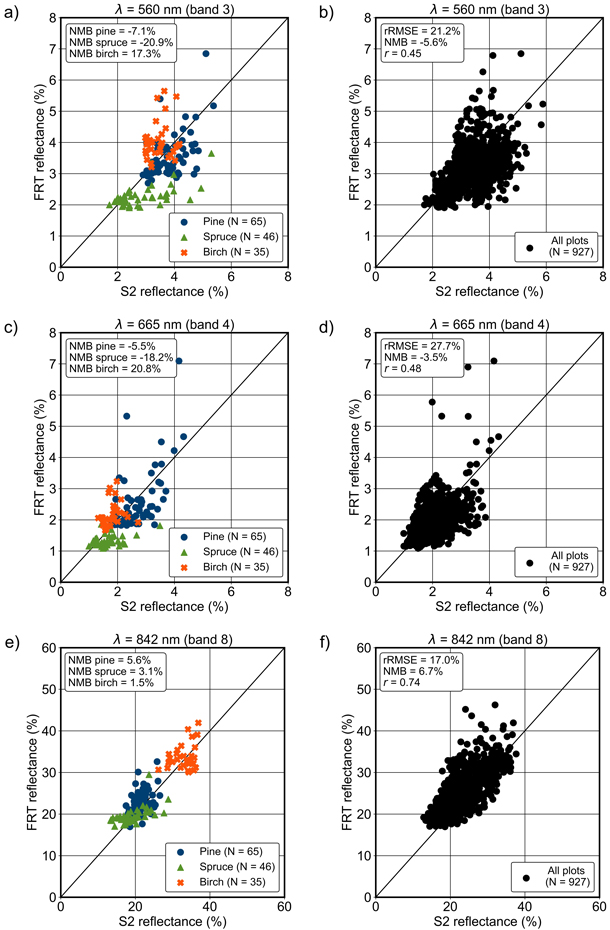
Fig. 8. FRT-simulated reflectances using the adjusted set of input parameter values in a, b) green, c, d) red and e, f) near infrared bands (for wavelengths 560, 665 and 842 nm, respectively) compared with Sentinel-2 (S2) MSI data. All pure pine, spruce and birch field plots in each study area (a, c and e), and all the used field plots combined (b, d and f, N = 927). The normalised mean bias (NMB), relative root-mean-square error (rRMSE) and Pearson correlation coefficient (r) are given in the subfigures.