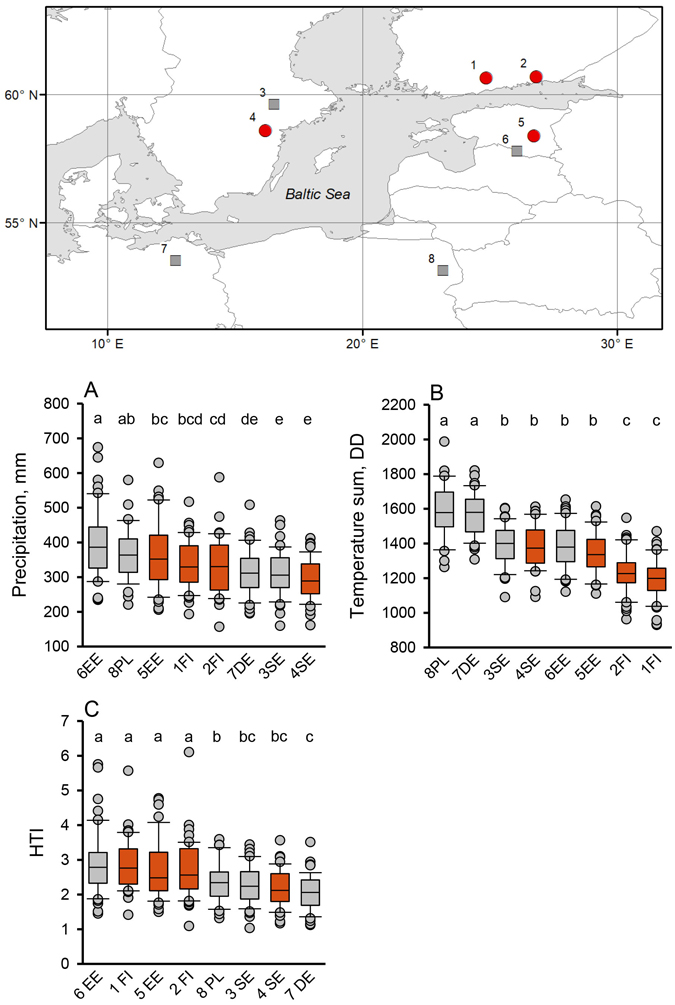
Fig. 1. The Baltic Sea area and the weather station locations (Table 1) whose data were used in this study (upper panel). Box plot graphs (below) show April to September medians and 25th and 75th percentiles (error bars: 10th and 90th percentiles) of (A) precipitation, (B) temperature sum, and (C) hydrothermic index (HTI) values at the given locations in the period 1950–1999. Different letters above the boxes indicate significant differences (LSD post hoc comparison P < 0.05) between locations. The future climate projections were made for four locations in Finland ([1] Hyvinkää, [2] Anjala), Sweden ([4] Norrköping), and Estonia ([5] Tarto) (red circles in the map refer to red boxes in A, B, and C). Additional locations from Sweden and Estonia (squares; [3] Västerås and [6] Valga) provide supportive climate data. The two weather stations in the Southern Baltic Sea area ([7] Teterow, NE Germany, and [8] Białystok, NE Poland) are located in current Ips typographus epidemic areas (2018–2020), as are the Swedish stations (3 and 4).
| Table 1. The names and coordinates of the weather stations (Fig. 1) whose data was used in this study, as given in the European Climate Assessment & Dataset (Climate Explorer, ECA&D 2021). |
| Country | Station name | Coordinates (deg) | Altitude (m a.s.l.) |
| 1 | Finland | HYVINKAA_HYVINKAANKYLA | 60.60N, 24.81E | 86 |
| 2 | Finland | KOUVOLA_ANJALA | 60.70N, 26.81E | 33 |
| 3 | Sweden | VASTERAS | 59.62N, 16.55E | 10 |
| 4 | Sweden | NORRKOPING-SORBY | 58.61N, 16.12E | 21 |
| 5 | Estonia | TARTU_ORAVERE* | 58.26N, 26.46E | 70 |
| 6 | Estonia | VALGA | 57.79N, 26.04E | 65 |
| 7 | Germany | TETEROW | 53.76N, 12.56E | 38 |
| 8 | Poland | BIALYSTOK | 53.11N, 23.16E | 148 |
| Table 2. The Coupled Model Intercomparison Project phase 5 (CMIP5) models and representative concentration pathway (RCP) scenarios used in this study. More information about the models can be found in Flato et al. (2013). |
| Model | RCP2.6 | RCP4.5 | RCP8.5 |
| ACCESS1.0 | | x | x |
| BCC-CSM1.1 | x | x | x |
| CanESM2 | x | x | x |
| CCSM4 | x | x | x |
| CMCC-CM | | x | x |
| CMCC-CMS | | x | x |
| CNRM-CM5 | x | x | x |
| EC-EARTH | x | x | x |
| GFDL-CM3 | x | x | x |
| GFDL-ESM2M | x | x | x |
| GISS-E2-R | | x | |
| HadGEM2-CC | | x | x |
| HadGEM2-ES | x | x | x |
| INM-CM4 | | x | x |
| IPSL-CM5A-LR | x | x | x |
| IPSL-CM5A-MR | x | x | x |
| MIROC5 | x | x | x |
| MIROC-ESM | x | x | x |
| MIROC-ESM-CHEM | x | x | x |
| MPI-ESM-LR | x | x | x |
| MPI-ESM-MR | x | x | x |
| MRI-CGCM3 | x | x | x |
| NorESM1-M | x | x | x |
| Table 3. One-way ANOVA results for precipitation (mmApr–Sep), temperature sum (DDApr–Sep), and hydrothermic index (HTI) between different locations in the Baltic Sea area for the period 1950–1999 (Fig. 1). The tested climate parameters are log-transformed. |
| Precipitation (mmApr–Sep) | Temperature sum (DDApr–Sep) | HTI |
| df | MS | F | P | df | MS | F | P | df | MS | F | P |
| Between groups | 7 | 0.085 | 8.83 | <0.001 | 7 | 0.085 | 52.53 | <0.001 | 7 | 0.165 | 12.10 | <0.001 |
| Within groups | 371 | 0.010 | | | 371 | 0.002 | | | 371 | 0.014 | | |
| Total | 378 | | | | 378 | | | | 378 | | | |
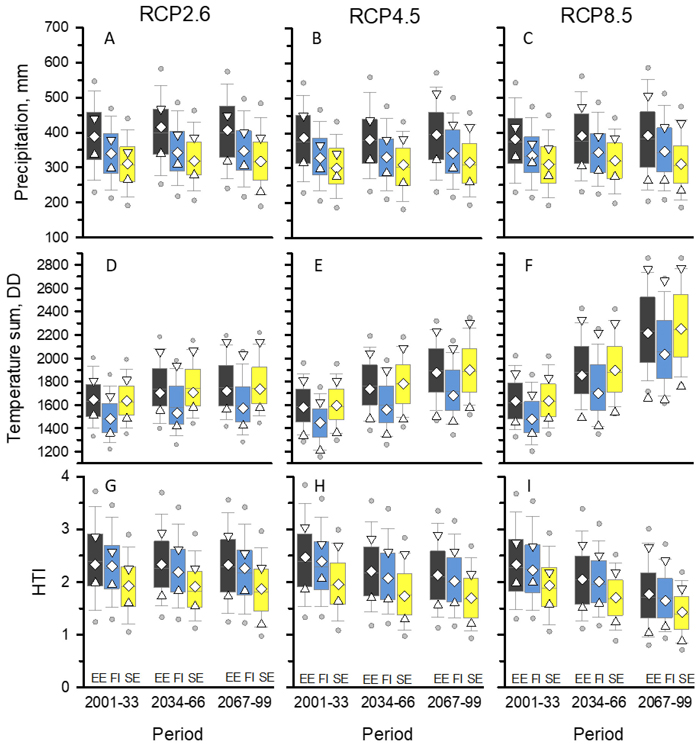
Fig. 2. Global circulation model (GCM) predictions for precipitation (mmApr-Sep), temperature sum (DDApr-Sep), and hydrothermic index (HTI) for three 33-year periods of the 21st century in Tartu, Estonia (EE); Anjala, Finland (FI); and Norrköping, Sweden (SE) under the three representative concentration pathway (RCP) simulations. Open symbols indicate values of the median (◊), maximum (∇), and minimum (Δ) climate models. Boxplots show the pooled data of 33 annual predictions of n climate models (n = the number of models; RCP2.6: n = 17; RCP4.5: n = 23; RCP8.5: n = 22). Boxplot: median and 25th and 75th percentiles (box), 5th and 95th percentiles (bars), and 1st and 99th percentiles (circles).
| Table 4. Generalized linear mixed model (GenLM) analysis results for the effects of Location, Period, and RCP (representative concentration pathway) scenario on global circulation model (GCM) prediction of precipitation (mmApr-Sep), temperature sum (DDApr-Sep), and HTI (Fig. 2). Locations (L): EE Tartu, FI Anjala, and SE Norrköping; Periods (P): 2001–2033, 2034–2066, and 2067–2099; RCP scenarios: RCP2.6, RCP4.5, and RCP8.5. The test parameter was the annual mean of n GCM predictions (n = the number of models; RCP2.6: n = 17; RCP4.5: n = 23; RCP8.5: n = 22). Numbers in bold are statistically significant. |
| Precipitation | Temperature sum | HTI |
| Wald χ2 | df | P | Wald χ2 | df | P | Wald χ2 | df | P |
| (Intercept) | 334 308.6 | 1 | <0.001 | 583 098.7 | 1 | <0.001 | 203 241.3 | 1 | <0.001 |
| Location | 2667.5 | 2 | <0.001 | 1085.7 | 2 | <0.001 | 1701.0 | 2 | <0.001 |
| Period | 59.2 | 2 | <0.001 | 3736.5 | 2 | <0.001 | 765.2 | 2 | <0.001 |
| RCP scenario | 42.8 | 2 | <0.001 | 1693.1 | 2 | <0.001 | 525.9 | 2 | <0.001 |
| L × P | 1.6 | 4 | 0.806 | 4.0 | 4 | 0.407 | 4.3 | 4 | 0.372 |
| L × RCP | 19.0 | 4 | 0.001 | 2.0 | 4 | 0.737 | 11.9 | 4 | 0.018 |
| P × RCP | 20.0 | 4 | <0.001 | 1297.1 | 4 | <0.001 | 290.4 | 4 | <0.001 |
| L × P × RCP | 2.4 | 8 | 0.966 | 1.0 | 8 | 0.998 | 1.0 | 8 | 0.998 |
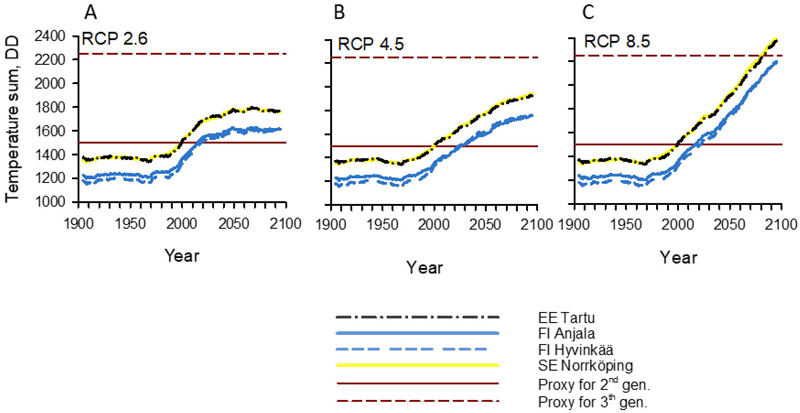
Fig. 3. Temperature sums (DDApr-Sep) for the period 1900–2100 in the Northern Baltic Sea Area under the (A) RCP2.6, (B) RCP4.5, and (C) RCP8.5 climate change scenarios. Graph lines show 11-year moving averages calculated from the annual averages of 17 models in the RCP2.6 scenario, 23 in the RCP4.5 scenario, and 22 in the RCP8.5 scenario. Locations (EE Tartu, FI Anjala, FI Hyvinkää, and SE Norrköping) are shown in Fig. 1. The annual temperature sums needed for the development of second (1500 DD) or third (2250 DD) generations (straight horizontal lines) of Ips typographus are based on the results of Annila (1969), which showed that approximately 750 DD is needed for the development of a single generation. The temperature sum lines of Tartu and Norrköping overlap in the graphs. RCP = representative concentration pathway.
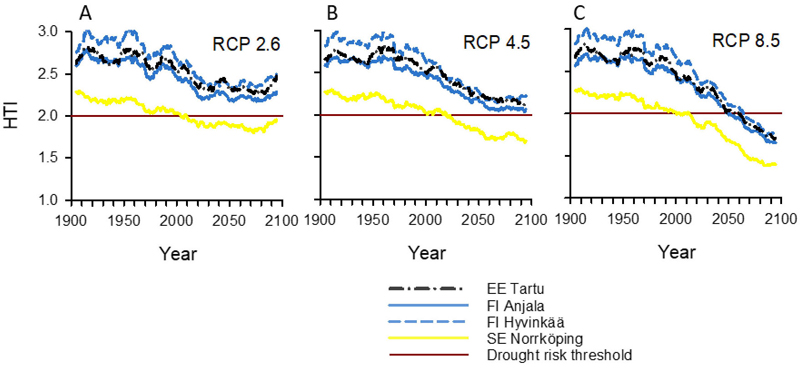
Fig 4. Hydrothermic index (HTI) values for the period 1900–2100 in the Northern Baltic Sea Area under the (A) RCP2.6, (B) RCP4.5, and (C) RCP 8.5 climate change scenarios. Graph lines show 11-year moving averages calculated from the annual averages of 17 models in the RCP2.6 scenario, 23 in the RCP4.5 scenario, and 22 in the RCP8.5 scenario. Locations (EE Tartu, FI Anjala, FI Hyvinkää, and SE Norrköping) are shown in Fig. 1. Values from the known current outbreak epidemic areas within the Baltic Sea Region were used to estimate the drought risk threshold (horizontal straight line), indicating suboptimal conditions for Norway spruce and increased risk of widespread Ips typographus epidemics (see Fig. 1 and Material and methods).
| Table 5. Percentage of years with moderate (HTI < 2.00) or severe (HTI < 1.75) drought risk under the three RCP climate change scenarios in the period 2020–2100. Percentages were calculated from annual values (multi-model mean of HTI) for each studied location. The indicative drought risk threshold (HTI < 2.00) was estimated from observed HTI values during recent SBB epidemics in NE Germany and EC Sweden (see Methods and Suppl. file S1: Fig. S2). HTI = hydrothermic index. RCP = representative concentration pathway. |
| Climate change scenario | HTI | Estonia | Finland | Finland | Sweden |
| Tartu | Anjala | Hyvinkää | Norrköping |
| RCP2.6 | <2.00 | 2 | 5 | 0 | 79 |
| <1.75 | 0 | 0 | 0 | 15 |
| RCP4.5 | <2.00 | 6 | 14 | 5 | 94 |
| <1.75 | 0 | 0 | 0 | 38 |
| RCP8.5 | <2.00 | 56 | 64 | 43 | 98 |
| <1.75 | 17 | 30 | 14 | 72 |