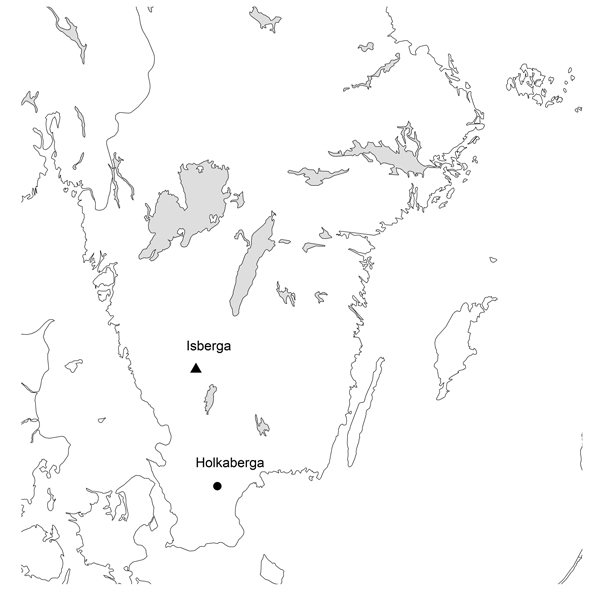
Fig. 1. Map displaying the location of the two experimental sites Isberga (filled triangle) in the province of Småland and Holkaberga (filled dot) in the province of Skåne where this study was conducted.
| Table 1. Site characteristics of the two experimental sites in southern Sweden used to study the effect of planting position and soil moisture conditions on the three species Norway spruce, Scots pine and silver birch. | ||
| Site | Isberga | Holkaberga |
| Year of clear felling | 2014 | 2018 |
| Year of establishment a | 2019 | 2020 |
| Site index b | G24 | G34 |
| Coordinates (WGS84) | 57°13´N, 13°25´E | 56°01´N, 13°50´E |
| Elevation (m a.s.l.) | 163 | 115 |
| Precipitation (mm) c | ||
| 1991–2020 | 983 (587) | 843 (486) |
| Study period | 1020 (567) | 844 (463) |
| Temperature (°C) d | ||
| 1991–2020 | 6.6 (11.4) | 8.1 (12.7) |
| Study period | 7.7 (12.0) | 9 (13.3) |
| Norway spruce e | SP75 / Lilla Istad FP – 502 | SA115 / Ekebo FT – 907 |
| Scots pine e | SA90 / Lilla Istad FP – 604A | SP75 / Gotthardsberg FP – 606B |
| Silver birch e | BP36 / Ekebo 5 FP – 809 | Plantek36 / Ekebo 5 FP – 809 |
| a Planting was done in the same year as the experimental establishment. b Site index derived from site properties as the height of the dominant trees after 100 years for Norway Spruce (G). c Average annual precipitation, derived from the nearest weather station (SMHI 2022) for the latest climate period (1991–2020) and the study period (2019–2021 Isberga and 2020–2022 Holkaberga). The value within the brackets represents the average precipitation during the growing season (April–October). Weather stations; Isberga – Skeppshult D (73070) (57°12´N, 13°40´E) and Holkaberga – Knopparp D (53570) (55°93´N, 13°85´E). d Average mean air temperature derived from the nearest weather station (SMHI 2022) for the latest climate period (1991–2020) and the study period (2019–2021 Isberga and 2020–2022 Holkaberga). Values within the brackets represent the average mean air temperature during the growing season (April–October). Weather stations: Isberga – Hagshult (74180) (57°29´N, 14°14´E) and Holkaberga – Hörby A (53530) (55°86´N, 13°67´E). e Information about the seedling type, i.e. container type (e.g. SP75) and provenance of the seed source (e.g. Lilla Istad FP – 502). Container type and provenance of the seed source are separated with a dash. | ||
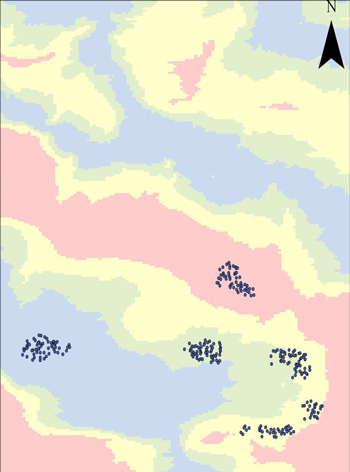
Fig. 2. Distribution of the planting spots in the different soil moisture conditions according to the soil moisture map (Depth-to-water-raster) at the experimental site Isberga in the province of Småland. Blue color = wet soil (superficial DTW, 0–0.5 m), green = moist (intermediate, 0.51–1 m), yellow = mesic (deep DTW, 1.01–2 m) and pink = dry (very deep DTW, 2.01 m-infinity). The DTW-raster was downloaded from the Swedish Forest Agency (SFA).
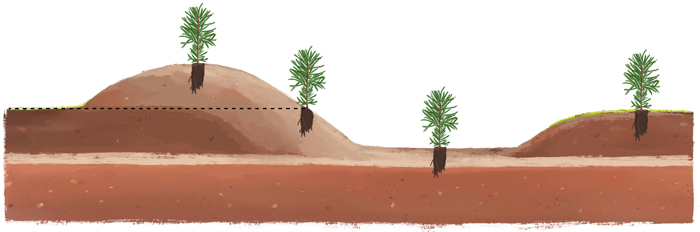
Fig. 3. Illustration of the different planting positions within a planting spot (mound) used in this study to check the effects on seedlings of Norway spruce, Scots pine and silver birch in different soil moisture conditions. From the left; Mound, Hinge, Depression, and Unscarified.
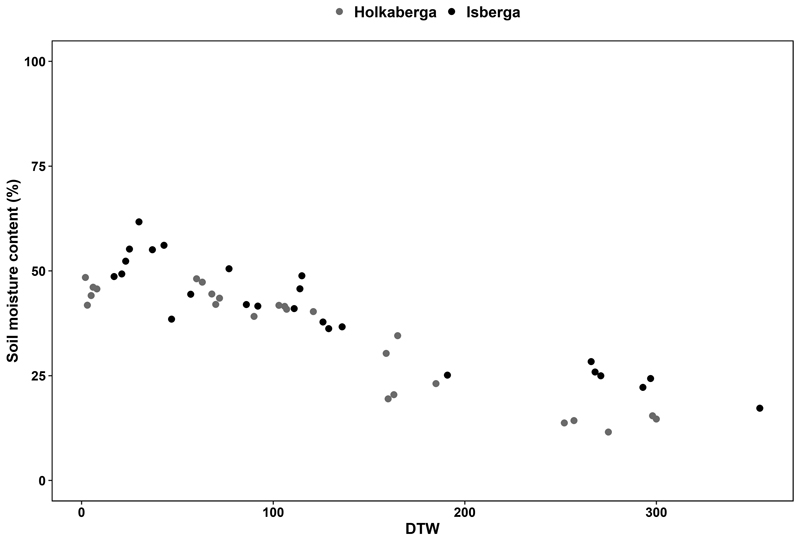
Fig. 4. The relation between depth-to-water (DTW), in cm, and soil moisture content (%) measured with Time domain reflectometer (TDR) in the unscarified control once a month between May and October for two years at the experimental site in Holkaberga (gray dots) and Isberga (black dots) in southern Sweden. Only measurements in the unscarified control are shown in this graph to represent the conditions when soil conditions have been unaltered.
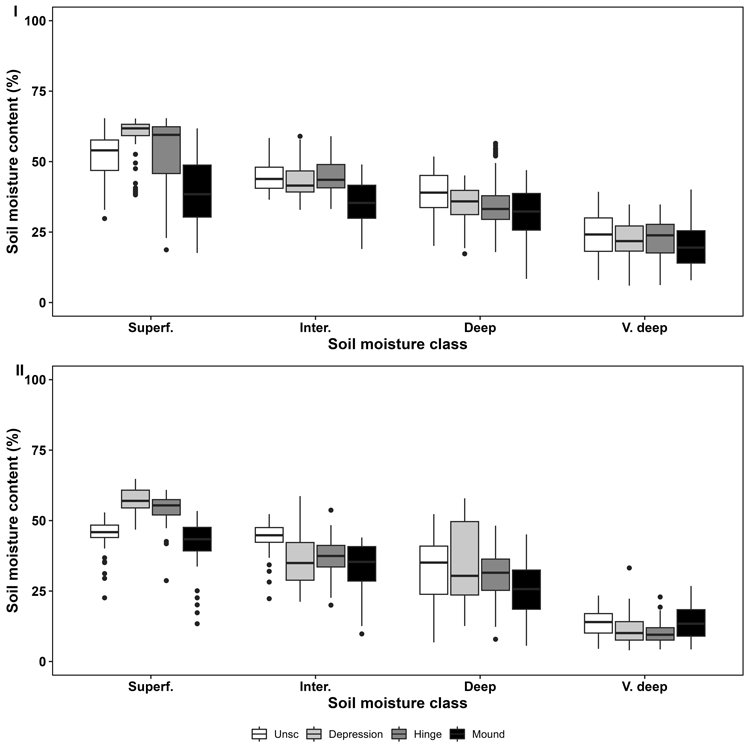
Fig. 5. Soil moisture content measured using a Time domain reflectometer (TDR), during two growing seasons in May to October in relation to soil moisture derived from the depth-to-water (DTW)-map in the four planting positions for the two experimental sites Isberga (I) and Holkaberga (II). Superf. = Superficial DTW (0–0.5 m depth); Inter. = Intermediate DTW (0.51–1 m depth); Deep = Deep DTW (1.01–2 m depth); V. deep = Very deep DTW (2.01 m – infinity depth). UnSc = Unscarified (white); Depression (light gray); Hinge (gray); Mound (black).
| Table 2. Results of the analysis of variance (p-values) for the fixed effects and their interaction after the first three growing seasons on mortality for the species Norway spruce, Scots pine and silver birch. Statistically significant effect (<0.05) is highlighted in bold. DTW = depth-to-water, Plantpos = planting position. | |
| p-value | |
| Effect | Mortality |
| DTW class | 0.3590 |
| Plantpos | <0.0001 |
| DTW class × Plantpos | <0.0001 |
| Species | 0.1152 |
| DTW class × Species | 0.4700 |
| Plantpos × Species | <0.0001 |
| DTW class × Plantpos × Species | 0.0144 |
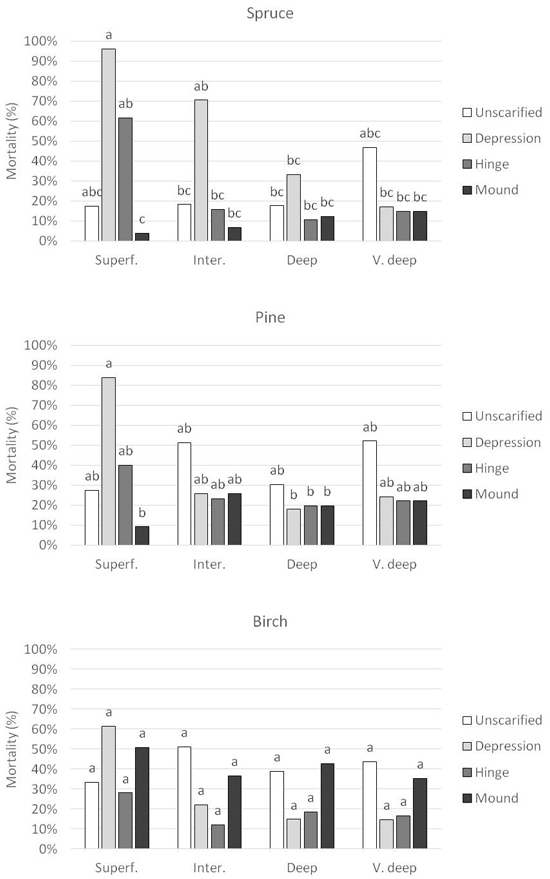
Fig. 6. Seedling mortality for the respective species, Norway spruce, Scots pine and silver birch planted in the four planting positions in each Depth-to-water (DTW) class. DTW classes are Superficial DTW (0–0.5 m depth), Intermediate DTW (0.51–1 m depth), Deep DTW (1.01–2 m depth), and Very deep DTW (2.01 m – infinity depth). Superf. = Superficial DTW; Inter = Intermediate DTW; Deep = Deep DTW; V. deep = Very deep DTW. Columns with different letters are significantly different. Since significant interactions occurred, comparisons are made between both DTW class and planting positions.
| Table 3. Major cause of damage for each species and planting spot treatment in percent of total damage for all seedlings used in the study. The percentage represents the combined results from both experimental sites Isberga and Holkaberga. The major causes of damage are represented by drought, water logging, fungal damage, browsing damage, insect damage, and unknown cause of damage. | |||||||
| Drought | Water a | Fungi | Browsing | Insects | Unknown | ||
| Spruce | Unscarified | 2 | 8 | 39 | 51 | ||
| Depression | 4 | 70 | 1 | 12 | 13 | ||
| Hinge | 2 | 62 | 13 | 23 | |||
| Mound | 21 | 63 | 16 | ||||
| Pine | Unscarified | 7 | 1 | 15 | 28 | 49 | |
| Depression | 59 | 4 | 11 | 26 | |||
| Hinge | 2 | 26 | 8 | 25 | 39 | ||
| Mound | 27 | 16 | 57 | ||||
| Birch | Unscarified | 43 | 40 | 4 | 13 | ||
| Depression | 36 | 29 | 12 | 23 | |||
| Hinge | 10 | 44 | 26 | 20 | |||
| Mound | 36 | 38 | 1 | 25 | |||
| a Water = Water logging. | |||||||
| Table 4. Results of the analysis of variance (p-values) for the fixed effects and their interaction after three growing seasons on height and diameter for Norway spruce, Scots pine, and silver birch. Each species was analyzed separately. Statistically significant effect (<0.05) is highlighted in bold. DTW = depth-to-water and Plantpos = planting position. | |||
| p-value | |||
| Species | Effect | Height | Diameter |
| Norway spruce | DTW class | 0.4819 | 0.3997 |
| Plantpos | 0.0003 | <0.001 | |
| DTW class × Plantpos | 0.0026 | <0.001 | |
| Scots pine | DTW class | 0.8093 | 0.7383 |
| Plantpos | 0.0140 | <0.001 | |
| DTW class × Plantpos | <0.001 | 0.0015 | |
| Silver birch | DTW class | 0.8267 | 0.7915 |
| Plantpos | <0.0001 | 0.0513 | |
| DTW class × Plantpos | 0.0106 | 0.0003 | |
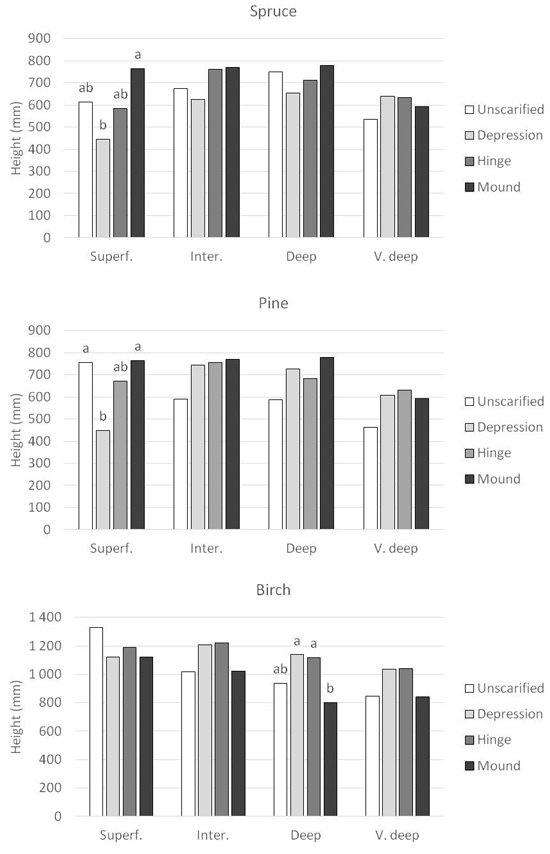
Fig. 7. Seedling height (mm) for the respective species, Norway spruce, Scots pine and silver birch planted in the four planning positions in each Depth-to-water (DTW) class. DTW classes are Superficial DTW (0–0.5 m depth), Intermediate DTW (0.51–1 m depth), Deep DTW (1.01–2 m depth), and Very deep DTW (2.01 m – infinity depth). Superf. = Superficial DTW; Inter = Intermediate DTW; Deep = Deep DTW; V. deep = Very deep DTW. Columns with different letters are significantly different within each DTW class. Columns without letters are not significantly different. Notice the different scale on the Y-axis for silver birch compared to Norway spruce and Scots pine.
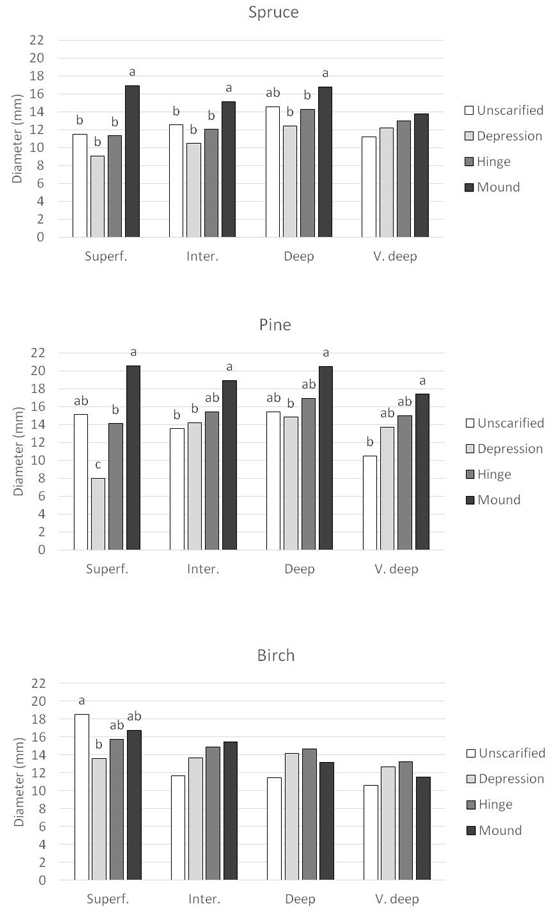
Fig. 8. Seedling diameter (mm) for the respective species, Norway spruce, Scots pine and silver birch planted in the four planning positions in each Depth-to-water class. DTW classes are Superficial DTW (0–0.5 m depth), Intermediate DTW (0.51–1 m depth), Deep DTW (1.01–2 m depth), and Very deep DTW (2.01 m – infinity depth). Superf. = Superficial DTW; Inter = Intermediate DTW; Deep = Deep DTW; V. deep = Very deep DTW. Columns with different letters are significantly different within each DTW class. Columns without letters are not significantly different.