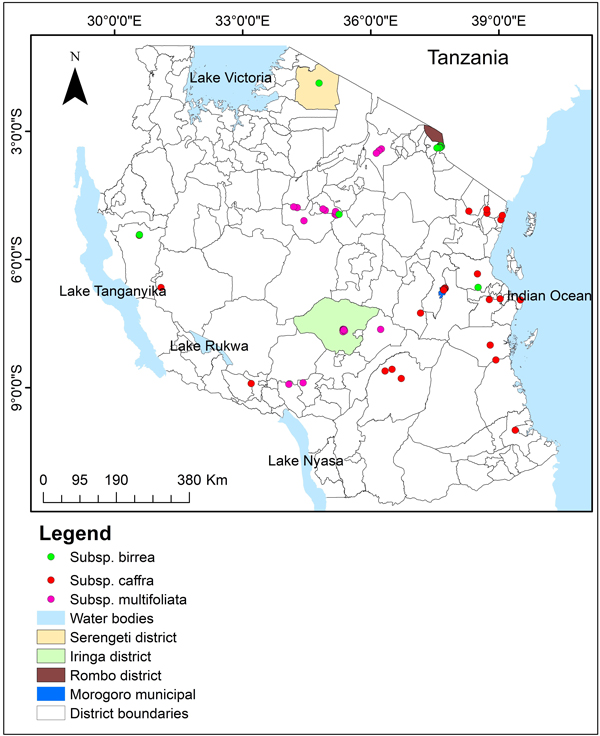
Fig. 1. Tanzania map showing study sites and the distribution of spatially-rarefied occurrence data for Marula tree (Sclerocarya birrea) subsp. birrea (green), subsp. caffra (red) and subsp. multifoliata (pink) in Tanzania.
| Table 1. The contribution of environmental factors that define the ecological niches of the Marula tree (Sclerocarya birrea) subspecies in Tanzania under the current environmental conditions. | |||||
| Subspecies | Code | Environmental variables | Percent contribution | Cumulative contribution | Permutation importance |
| (a) Subsp. caffra | Bio14 | Precipitation of Driest Month | 47.0 | 47.0 | 3.2 |
| ELV | Elevation | 20.5 | 67.5 | 31.7 | |
| CLY | Clay soil fraction | 11.4 | 78.9 | 23.8 | |
| SLT | Silt soil fraction | 9.7 | 88.6 | 4.4 | |
| Bio19 | Precipitation of Coldest Quarter | 4.3 | 92.9 | 10.1 | |
| Bio08 | Mean Temperature of Wettest Quarter | 3.6 | 96.5 | 9.9 | |
| SLP | Slope | 0.7 | 97.2 | 6.5 | |
| ELC | Soil electrical conductivity | 0.7 | 97.9 | 6.1 | |
| ASP | Aspect | 0.7 | 98.6 | 2.5 | |
| Bio18 | Precipitation of Warmest Quarter | 0.5 | 99.1 | 0.5 | |
| AWC | Available water holding capacity | 0.4 | 99.5 | 0.0 | |
| Bio01 | Annual Mean Temperature | 0.3 | 99.8 | 0.4 | |
| pH | Soil pH | 0.1 | 99.9 | 0.9 | |
| (b) Subsp. multifoliata | Bio19 | Precipitation of Coldest Quarter | 38.6 | 38.6 | 5.3 |
| Bio12 | Annual Precipitation | 16.1 | 54.7 | 27.3 | |
| PET | Potential Evapotranspiration | 13.2 | 67.9 | 39.9 | |
| SOC | Soil organic carbon concentration | 10.8 | 78.7 | 0.3 | |
| Bio15 | Precipitation Seasonality | 10.4 | 89.1 | 14 | |
| CLY | Clay soil fraction | 4.0 | 93.1 | 2.6 | |
| Bio18 | Precipitation of Warmest Quarter | 3.0 | 96.1 | 4.0 | |
| SLP | Slope | 2.5 | 98.6 | 3.0 | |
| ASP | Aspect | 0.9 | 99.5 | 0.0 | |
| Bio07 | Temperature Annual Range | 0.3 | 99.8 | 1.3 | |
| ELC | Soil electrical conductivity | 0.1 | 99.9 | 1.6 | |
| (c) Subsp. birrea | CEC | Soil cation exchange capacity | 47.2 | 47.2 | 3.7 |
| Bio14 | Precipitation of Driest Month | 16.9 | 64.1 | 32.7 | |
| SLP | Slope | 8.9 | 73.0 | 39.8 | |
| PET | Potential evapotranspiration | 6.3 | 79.3 | 0.5 | |
| Bio18 | Precipitation of Warmest Quarter | 5.3 | 84.6 | 17.4 | |
| Bio19 | Precipitation of Coldest Quarter | 4.6 | 89.2 | 3.6 | |
| pH | Soil pH | 4.5 | 93.7 | 0.0 | |
| SOC | Soil organic carbon concentration | 3.9 | 97.6 | 0.5 | |
| SLT | Silt soil fraction | 2.2 | 99.8 | 1.6 | |
| ASP | Aspect | 0.1 | 99.9 | 0.2 | |
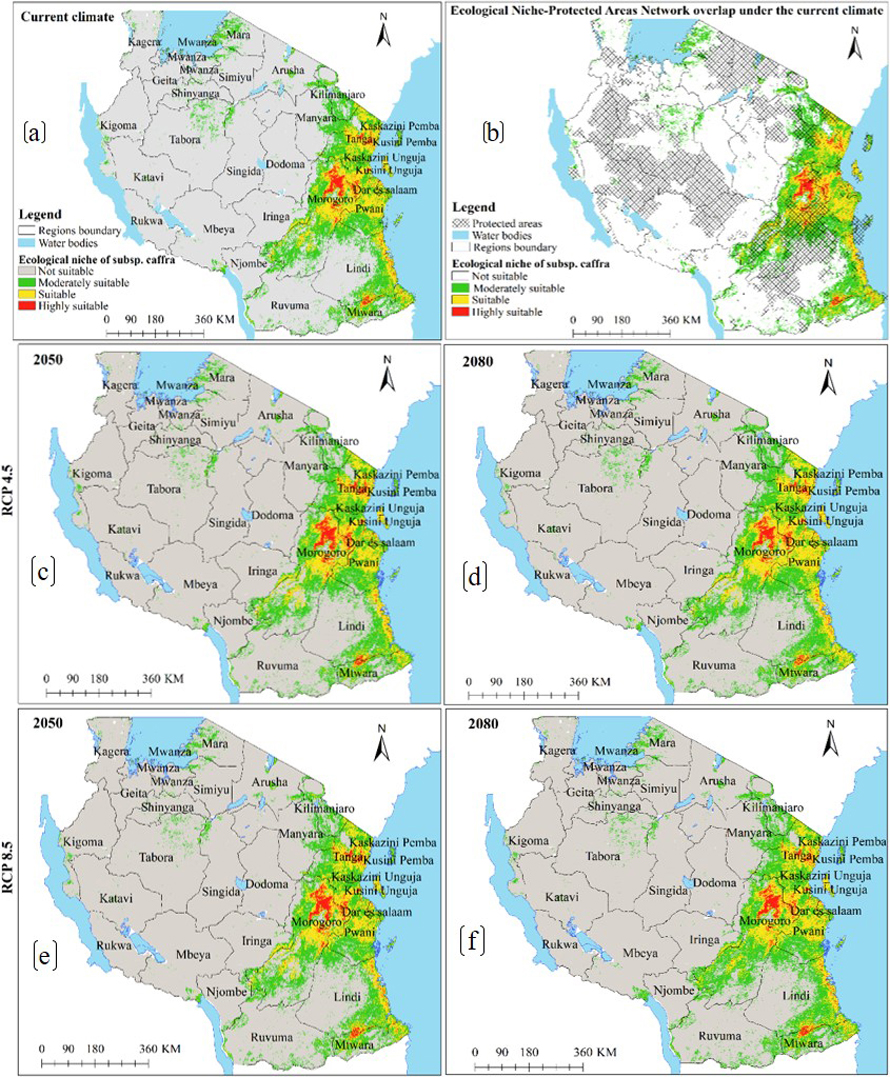
Fig. 2. Ecological Niches of Marula tree (Sclerocarya birrea) subsp. caffra in Tanzania: (a) ecological niche under the current environmental conditions, (b) ecological niche-protected areas network overlap under the current environmental conditions and, (c)–(f) are ecological niches under RCP4.5 and RCP8.5 for the years 2050 and 2080 predicted by using CCSM4 model. Note: “RCP” is representative concentration pathway and “CCSM4” is Community Climate System Model version 4.
| Table 2. Ecological niches of Marula tree (Sclerocarya birrea) (a) subsp. caffra (b) subsp. multifoliata and (c)subsp. birrea in Tanzania under the current environmental conditions and future climates as predicted by CCSM4 and HadGEM2-ES models under RCP4.5 and RCP8.5 for the year 2050 and 2080. Note: “RCP” is representative concentration pathway; “CCSM4” is Community Climate System Model version 4, and “HadGEM2-ES” is Hadley Centre Global Environmental Model 2-Earth System. | ||||||||||
| Subspecies name | Ecological niche class of suitability | Area (km2) under the current climate | Area (km2) under RCP4.5 | Area (km2) under RCP8.5 | ||||||
| CCSM4 | HadGEM2-ES | CCSM4 | HadGEM2-ES | |||||||
| 2050 | 2080 | 2050 | 2080 | 2050 | 2080 | 2050 | 2080 | |||
| (a) Subsp. caffra | Not suitable | 694 327 | 708 571 | 701 428 | 705 702 | 696 233 | 724 908 | 695 131 | 709 449 | 695 147 |
| Moderately suitable | 114 307 | 103 717 | 105 710 | 106 031 | 114 073 | 110 633 | 116 027 | 102 684 | 112 284 | |
| Suitable | 62 368 | 57 890 | 64 397 | 58 913 | 60 838 | 59 531 | 60 179 | 57 830 | 64 125 | |
| Highly suitable | 8140 | 8963 | 7605 | 8495 | 7998 | 9123 | 7804 | 9177 | 7584 | |
| Total suitable area | 184 814 | 170 570 | 177 713 | 173 438 | 182 908 | 179 287 | 184 009 | 169 691 | 183 994 | |
| Protected areas | 58 306 | 53 419 | 56 573 | 54 965 | 59 303 | 54 497 | 59 245 | 53 393 | 59 335 | |
| Other land uses | 126 508 | 117 151 | 121 139 | 118 473 | 123 605 | 124 790 | 124 764 | 116 299 | 124 658 | |
| (b) Subsp. multifoliata | Not suitable | 757 251 | 763 077 | 768 075 | 762 276 | 762 870 | 769 740 | 769 613 | 769 225 | 770 232 |
| Moderately suitable | 98 726 | 95 129 | 88 563 | 94 965 | 94 413 | 90 310 | 89 795 | 89 443 | 90 048 | |
| Suitable | 35 303 | 33 099 | 34 024 | 33 865 | 33 706 | 30 678 | 32 200 | 31 683 | 30 657 | |
| Highly suitable | 5889 | 5865 | 6507 | 6063 | 6180 | 6441 | 5561 | 6819 | 6232 | |
| Total suitable area | 139 918 | 134 093 | 129 094 | 134 894 | 134 299 | 127 429 | 127 556 | 127 945 | 126 937 | |
| Protected areas | 47 566 | 44 413 | 41 849 | 47 074 | 46 285 | 41 832 | 41 660 | 44 990 | 42 943 | |
| Other land uses | 92 352 | 89 680 | 87 246 | 87 819 | 88 014 | 85 597 | 85 897 | 82 955 | 83 994 | |
| (c) Subsp. birrea | Not suitable | 851 201 | 868 169 | 863 270 | 863 902 | 862 936 | 864 283 | 861 796 | 863 310 | 863 379 |
| Moderately suitable | 23 749 | 24 150 | 13 333 | 12 649 | 13 448 | 12 440 | 14 510 | 13 283 | 13 432 | |
| Suitable | 4024 | 4137 | 2500 | 2544 | 2675 | 2372 | 2783 | 2520 | 2293 | |
| Highly suitable | 672 | 713 | 544 | 552 | 588 | 551 | 557 | 534 | 543 | |
| Total suitable area | 28 446 | 29 000 | 16 377 | 15 745 | 16 711 | 15 364 | 17 851 | 16 337 | 16 268 | |
| Protected areas | 14 550 | 14 532 | 9439 | 8794 | 9408 | 8264 | 10 237 | 9124 | 8601 | |
| Other land uses | 13 895 | 14 468 | 6937 | 6950 | 7303 | 7100 | 7614 | 7213 | 7667 | |
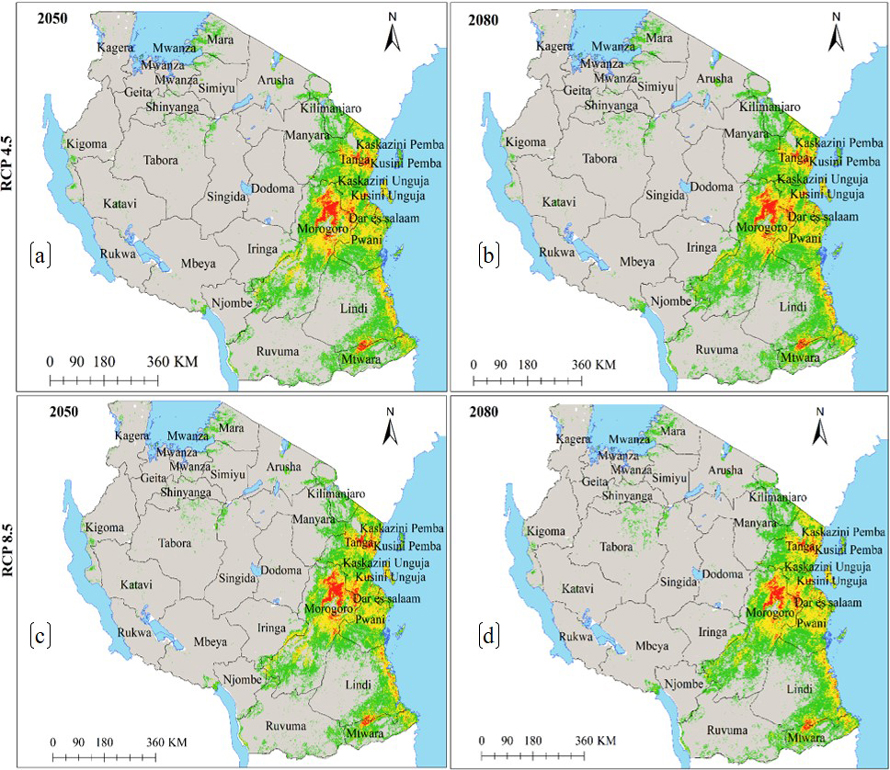
Fig. 3. Future Ecological Niches of Marula tree (Sclerocarya birrea) subsp. caffra in Tanzania under RCP4.5 and RCP8.5 for the years 2050 and 2080 predicted by using HadGEM2-ES model. Note: “RCP” is representative concentration pathway and “HadGEM2-ES” is Hadley Centre Global Environmental Model 2-Earth System.
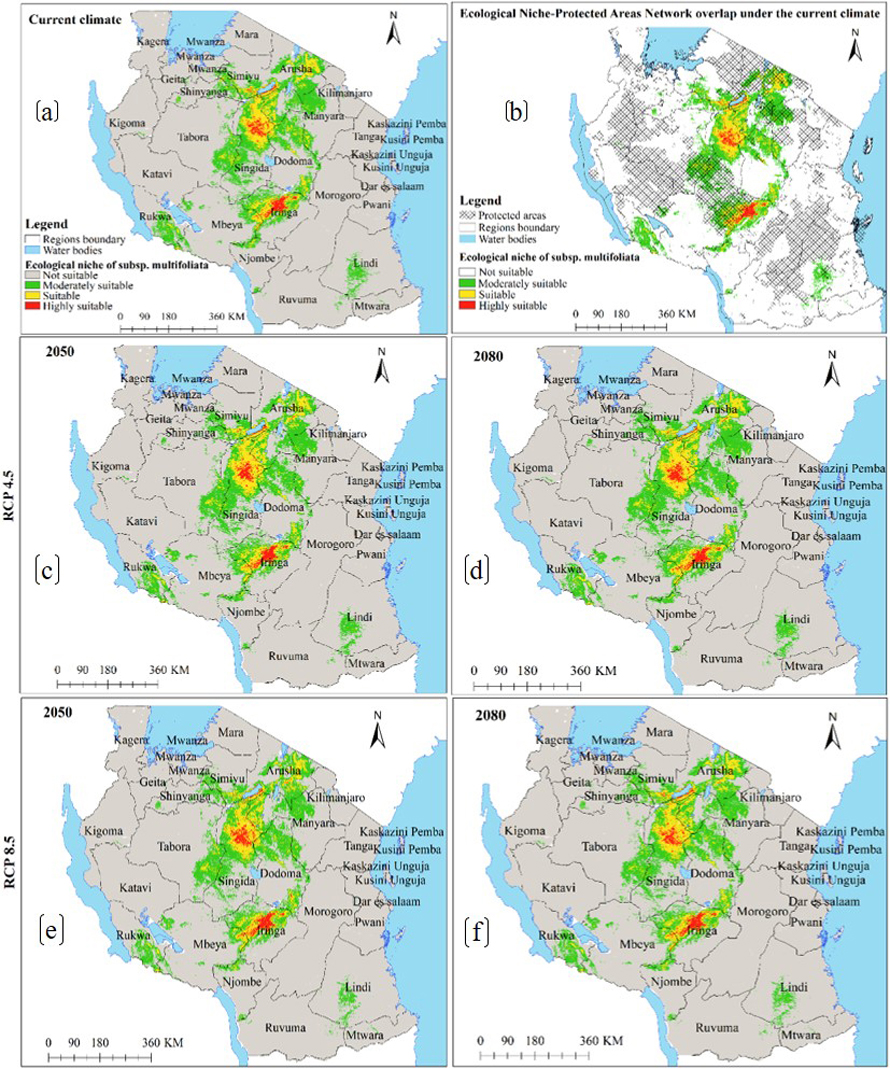
Fig. 4. Ecological Niches of Marula tree (Sclerocarya birrea) subsp. multifoliata in Tanzania: (a) ecological niche under the current environmental conditions, (b) ecological niche-protected areas network overlap under the current environmental conditions and, (c)–(f) are ecological niches under RCP4.5 and RCP8.5 for the years 2050 and 2080 predicted by using CCSM4 model. Note: “RCP” is representative concentration pathway and “CCSM4” is Community Climate System Model version 4.
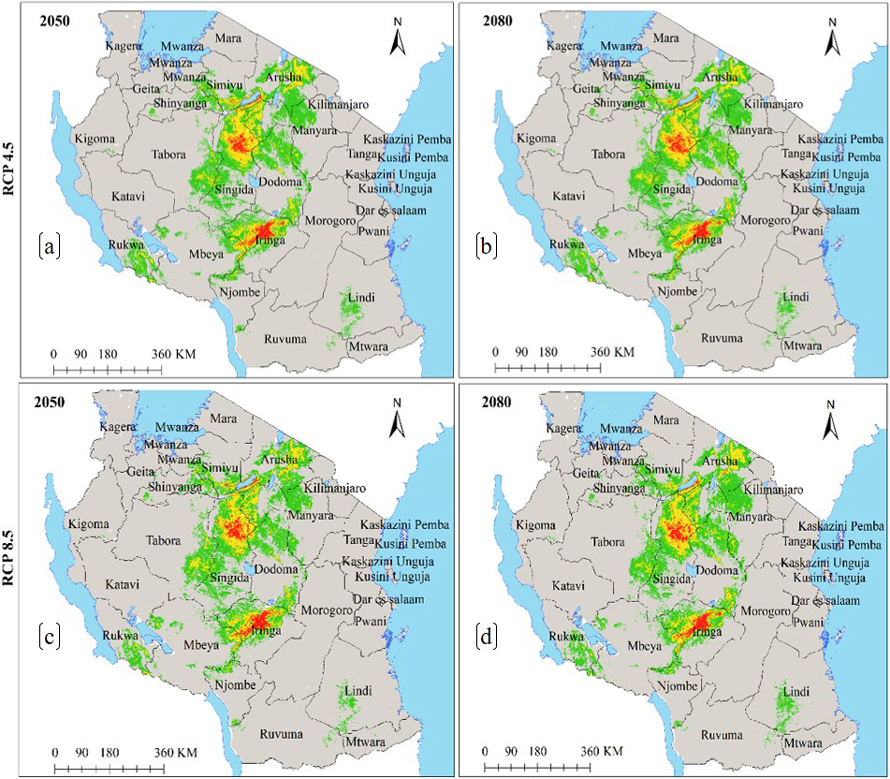
Fig. 5. Future Ecological Niche of Marula tree (Sclerocarya birrea) subsp. multifoliata in Tanzania under RCP4.5 and RCP8.5 for the years 2050 and 2080 predicted by using HadGEM2-ES model. Note: “RCP” is representative concentration pathway and “HadGEM2-ES” is Hadley Centre Global Environmental Model 2-Earth System.
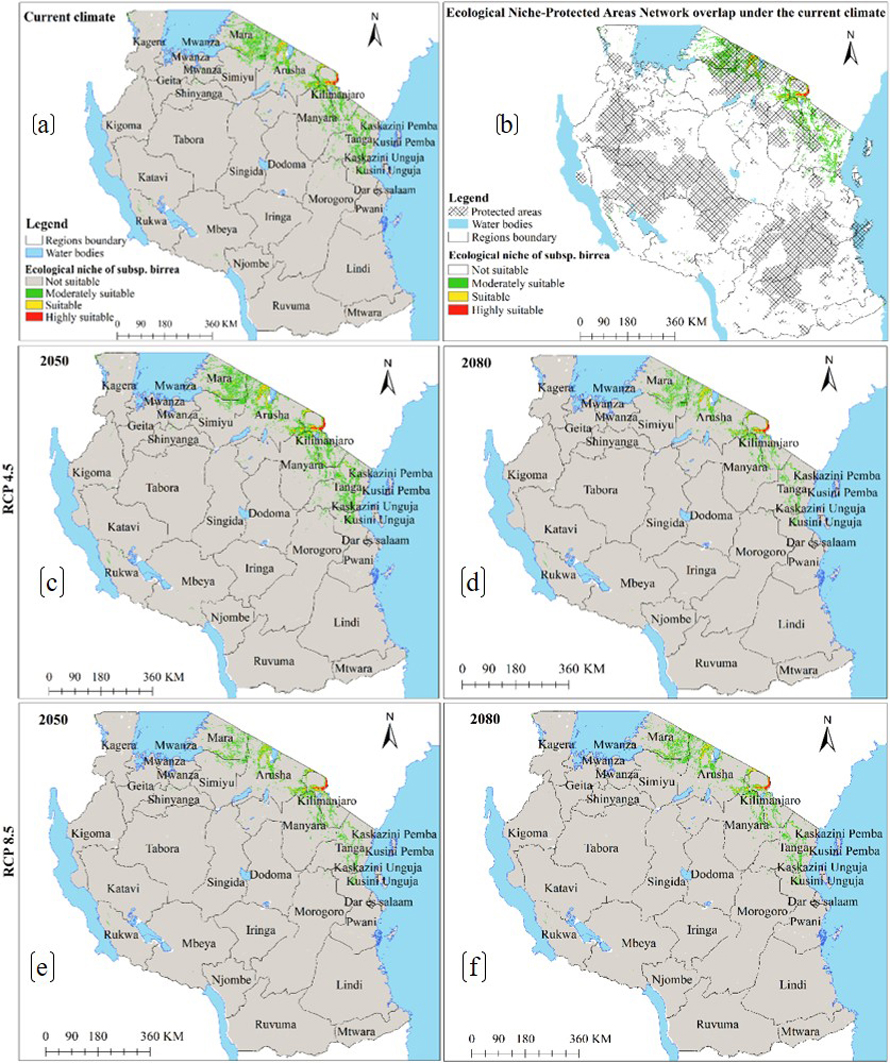
Fig. 6. Ecological Niches of Marula tree (Sclerocarya birrea) subsp. birrea in Tanzania: (a) ecological niche under the current environmental conditions, (b) ecological niche-protected areas network overlap under the current environmental conditions and, (c)–(f) are ecological niches under RCP4.5 and RCP8.5 for the years 2050 and 2080 predicted by using CCSM4 model. Note: “RCP” is representative concentration pathway and “CCSM4” is Community Climate System Model version 4.
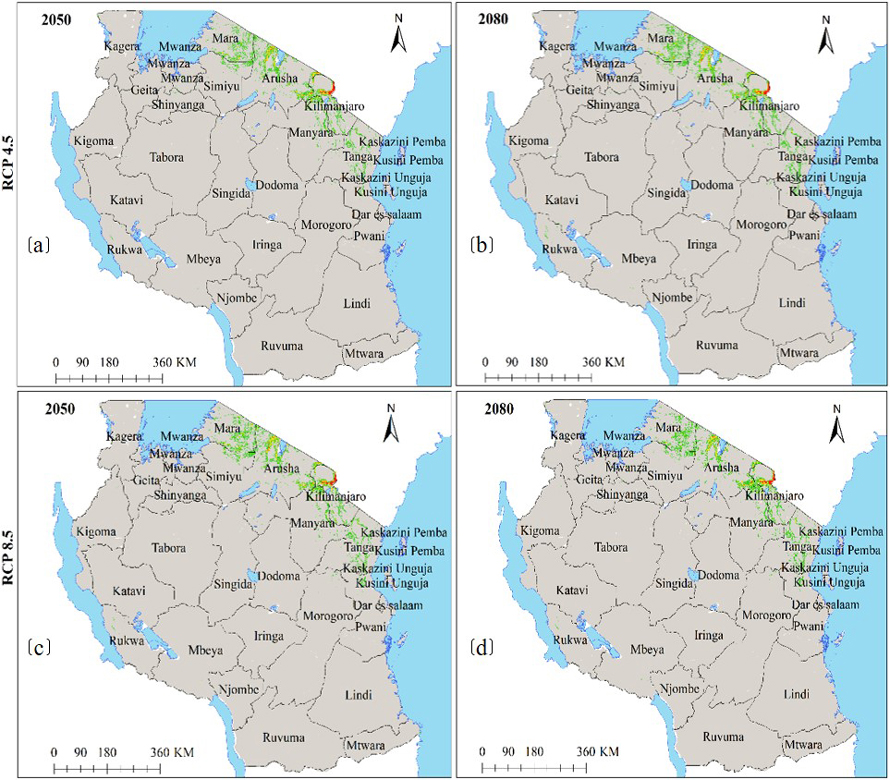
Fig. 7. Future Ecological Niche of Marula tree (Sclerocarya birrea) subsp. birrea in Tanzania under RCP4.5 and RCP8.5 for the years 2050 and 2080 predicted by using HadGEM2-ES model. Note: “RCP” is representative concentration pathway and “HadGEM2-ES” is Hadley Centre Global Environmental Model 2-Earth System.
| Table 3. Mean Area Change in km2 of ecological niches of Marula tree (Sclerocarya birrea) (a) subsp. caffra (b) subsp. multifoliata and (c) subsp. birrea in Tanzania under future climates as predicted by CCSM4 and HadGEM2-ES models under RCP4.5 and RCP8.5 for the years 2050 and 2080. Note: “RCP” is a representative concentration pathway; “CCSM4” is Community Climate System Model version 4; “HadGEM2-ES” is Hadley Centre Global Environmental Model 2-Earth System; figures with “–” sign indicate a decrease/negative change and that with “+” indicates an increase/positive change in predicted mean area, and “%” implies mean area change in percentage. | |||||||||
| Subspecies name | Ecological niche suitability class | RCP4.5 | RCP8.5 | ||||||
| 2050 | 2080 | 2050 | 2080 | ||||||
| Area change | % | Area change | % | Area change | % | Area change | % | ||
| (a) Subsp. caffra | Not suitable | +12 810 | +1.8 | +4504 | +0.6 | +22 852 | +3.3 | +813 | +0.1 |
| Moderately suitable | –9432 | –8.3 | –4415 | –3.9 | –7648 | –6.7 | –151 | –0.1 | |
| Suitable | –3967 | –6.4 | +250 | +0.4 | –3687 | –5.9 | –216 | –0.3 | |
| Highly suitable | +589 | +7.2 | –338 | –4.2 | +1011 | +12.4 | –446 | –5.5 | |
| Total suitable area | –12 810 | –6.9 | –4504 | –2.4 | –10 325 | –5.6 | –813 | –0.4 | |
| Protected areas | –4114 | –7.1 | –367 | –0.6 | –4361 | –7.5 | +985 | +1.7 | |
| Other land uses | –8696 | –6.9 | –4136 | –3.3 | –5964 | –4.7 | –1797 | –1.4 | |
| (b) Subsp. multifoliata | Not suitable | +5425 | +0.7 | +5722 | +0.8 | +12 231 | +1.6 | +12 671 | +1.7 |
| Moderately suitable | –3679 | –3.7 | –3955 | –4.0 | –8849 | –9.0 | –8804 | –8.9 | |
| Suitable | –1821 | –5.2 | –1900 | –5.4 | –4122 | –11.7 | –3875 | –11.0 | |
| Highly suitable | +75 | +1.3 | +133 | +2.3 | +741 | +12.6 | +7 | +0.1 | |
| Total suitable area | –5425 | –3.9 | –5722 | –4.1 | –12 231 | –8.7 | –12 671 | –9.1 | |
| Protected areas | –1822 | –3.8 | –3499 | –7.4 | –4155 | –8.7 | –5265 | –11.1 | |
| Other land uses | –3602 | –3.9 | –4722 | –5.1 | –8076 | –8.7 | –7407 | –8.0 | |
| (c) Subsp. birrea | Not suitable | +14 835 | +1.7 | +11 902 | +1.4 | +12 595 | +1.5 | +11 386 | +1.3 |
| Moderately suitable | –5350 | –22.5 | –10 359 | –43.6 | –10 888 | –45.8 | –9778 | –41.2 | |
| Suitable | –684 | –17.0 | –1437 | –35.7 | –1578 | –39.2 | –1486 | –36.9 | |
| Highly suitable | –39 | –5.8 | –106 | –15.7 | –130 | –19.3 | –122 | –18.1 | |
| Total suitable area | –6073 | –21.4 | –11 902 | –41.8 | –12 595 | –44.3 | –11 386 | –40.0 | |
| Protected areas | –2887 | –19.8 | –5126 | –35.2 | –5856 | –40.2 | –5131 | –35.3 | |
| Other land uses | –3186 | –22.9 | –6775 | –48.8 | –6739 | –48.5 | –6255 | –45.0 | |