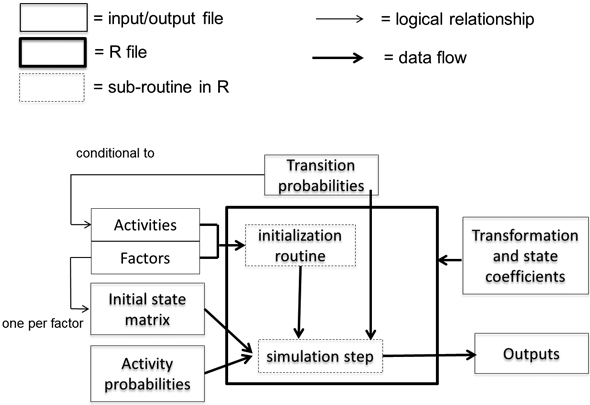
Fig. 1. The parameter environment of the European Forestry Dynamics Model (EFDM) (Vauhkonen et al. 2019).
| Table 1. Final predictors and coefficients of Eq. 1, when fitted to National Forest Inventory (NFI) and moose population data. By default, the model predicts for zone 1 (Northern Finland), while zones 2–4 correspond to Western, Eastern, and Southern Finland, respectively, corresponding to specific dummy variables. Predictor variables ForestArea_km2, MoosePop_1000ha, Seedling_prop and Mature_prop denote forest area (km2), moose population density (animals per 1000 ha of land area), and proportions of seedling and mature stands (%), respectively. Asterisks (*) indicate interactions between two variables. | ||||
| Variable | Value | S.E. | t-value | p-value |
| Intercept | 5.72 | 1.22 | 4.69 | 0.00 |
| Zone2 | 3.19 | 2.94 | 1.08 | 0.28 |
| Zone3 | –1.60 | 2.26 | –0.71 | 0.48 |
| Zone4 | –8.08 | 2.92 | –2.77 | 0.01 |
| ForestArea_km2 | 1.8 × 10⁻⁴ | 3.0 × 10⁻⁵ | 6.05 | 0.00 |
| MoosePop_1000ha | 0.19 | 0.04 | 4.65 | 0.00 |
| Seedling_prop | –0.04 | 0.03 | –1.29 | 0.20 |
| Mature_prop | –0.03 | 0.02 | –1.80 | 0.08 |
| Zone2*Seedling_prop | –0.03 | 0.04 | –0.63 | 0.53 |
| Zone3*Seedling_prop | 0.10 | 0.04 | 2.59 | 0.01 |
| Zone4*Seedling_prop | 0.16 | 0.05 | 3.58 | 0.00 |
| Zone2*Mature_prop | –0.04 | 0.03 | –1.24 | 0.22 |
| Zone3*Mature_prop | –0.01 | 0.02 | –0.31 | 0.76 |
| Zone4*Mature_prop | 0.07 | 0.04 | 1.62 | 0.11 |
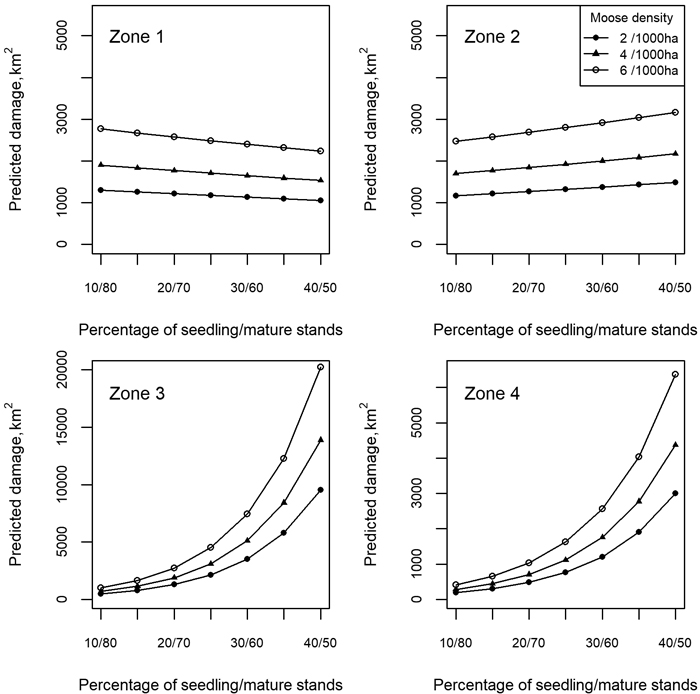
Fig. 2. Zone-specific differences in damage area predictions with three moose population sizes and fixed seedling and mature stand proportions, where zone numbers 1–4 refer to the geographical zones of Northern, Western, Eastern, and Southern Finland, respectively.
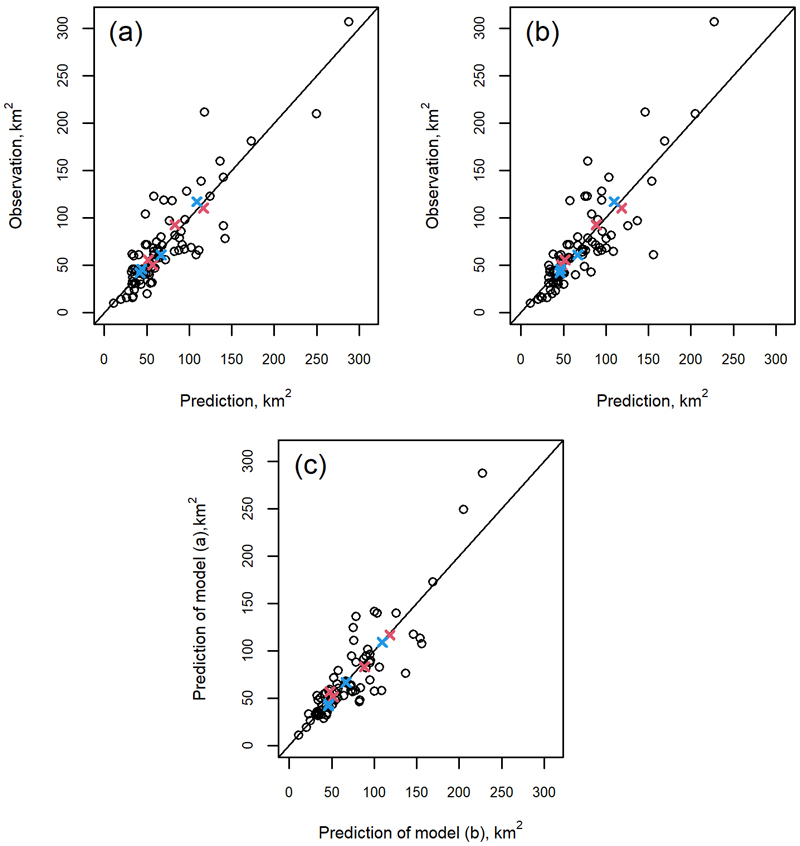
Fig. 3. Comparison of moose damage predicted using the observed moose population density and (a) the model of Nikula et al. (2021) or (b) the model developed in this study, against reference observations from the moose management areas, with (c) an intercomparison of the predictions of the two models. Red and blue crosses indicate the mean of the observations by the 10th and 11th National Forest Inventory (NFI), respectively, for the four geographical zones (Northern, Western, Eastern and Southern Finland) used as modeling units in the forest development simulations.
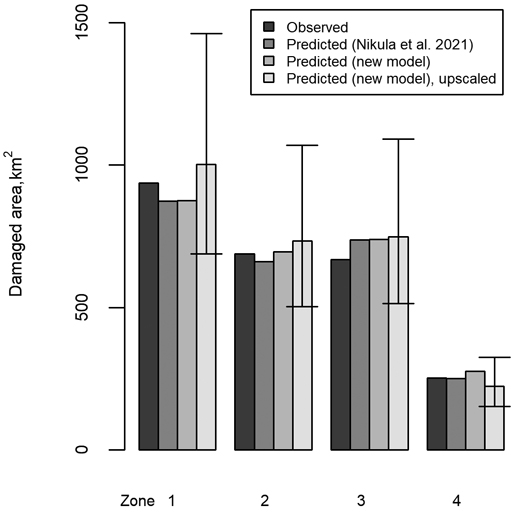
Fig. 4. Comparison of moose damage, when the observed and predicted damage are summed up for the geographical zones 1–4 (Northern, Western, Eastern and Southern Finland, respectively) from the individual moose management areas. The predictions of Nikula et al. (2021) and the model developed in this study are first shown with the values for the predictor variables extracted from the reference data. Then, in the upscaled case, the model developed for this study is used as in the case of the actual simulations, i.e., scaling up the prediction for an average-sized moose management area within a zone and assuming a fixed moose population of 4 animals per 1000 ha for the thick bars and 2 or 6 animals per 1000 ha for the lower and upper limits of the error bars, respectively.
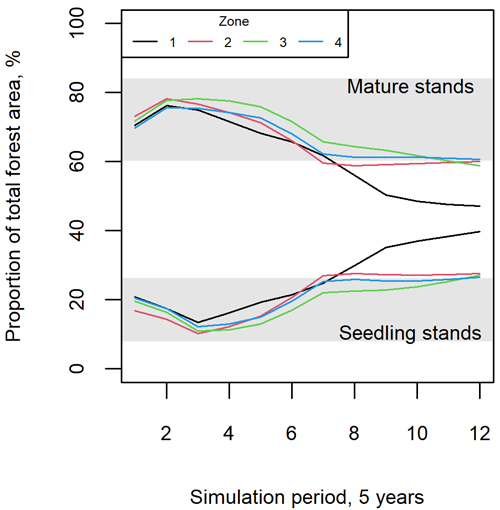
Fig. 5. Proportions of mature (upper lines and area) vs. seedling stands in the modeling data (grey area) and different simulation periods, when projecting the forest development with the European Forestry Dynamics Model (EFDM). Zones 1–4 correspond to Northern, Western, Eastern and Southern Finland, respectively.
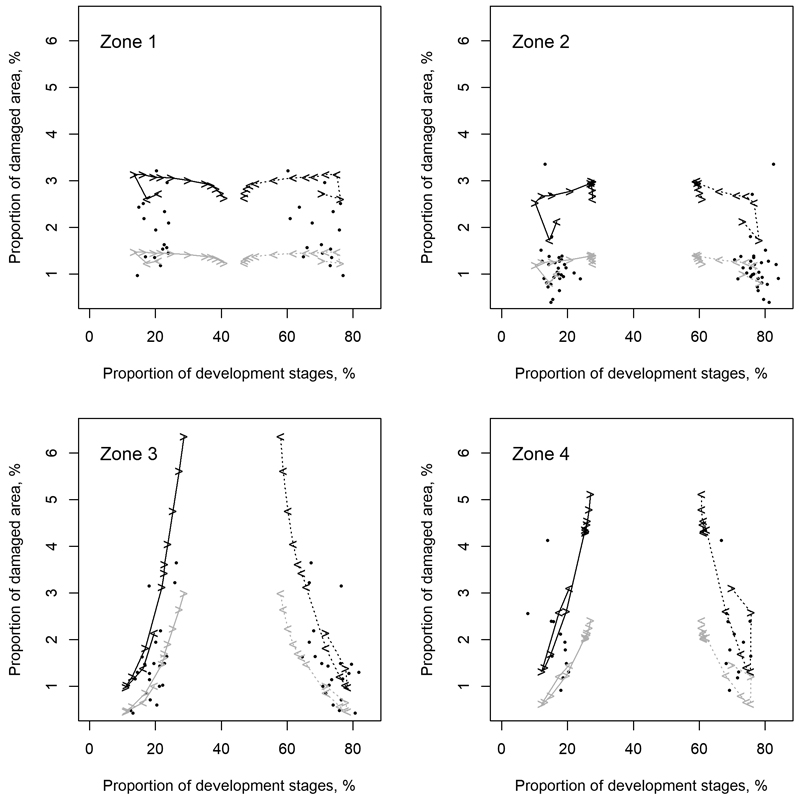
Fig. 6. Proportion of development stages (i.e., seedling and mature stands, x-axis) vs. the proportion of damaged area to the total forest area of the four geographical zones (numbers 1–4 indicated in the subfigures correspond to Northern, Western, Eastern, and Southern Finland, respectively). The dots and lines show the observations in the training data and the simulated forest development, respectively. Black and grey lines show simulation results based on 6 and 2 animals per 1000 ha, respectively. Solid and dashed lines show the proportion of seedling and mature stands in the simulations. The arrowheads on the lines indicate these proportions at each simulation step and the direction in which their simulated values evolved from that step.
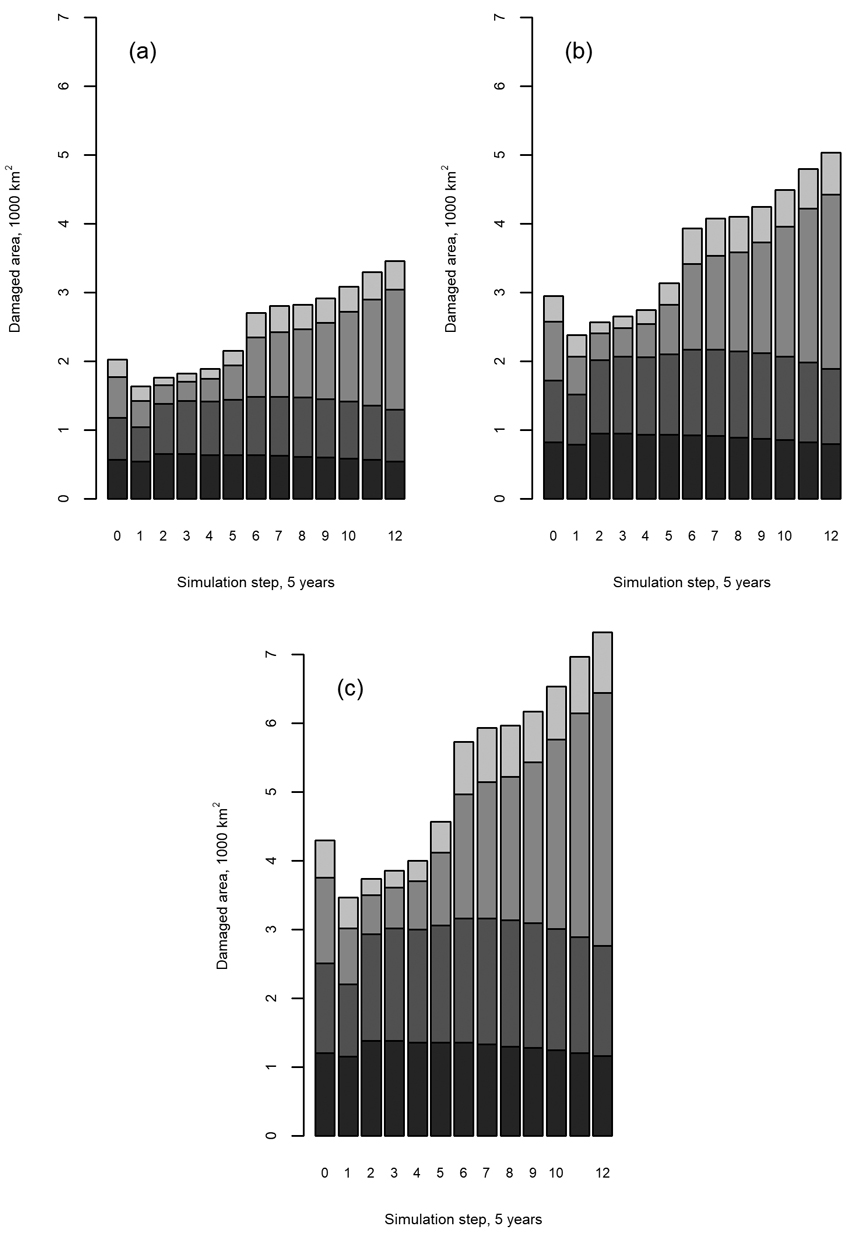
Fig. 7. Total continuous moose damage to seedling stands based on moose population sizes of (a) 2, (b) 4, or (c) 6 animals per 1000 ha. The shades of grey in each bar correspond, from bottom to up, to the geographical zones of Northern, Western, Eastern, and Southern Finland. Step 0 indicates the modeled initial state, i.e. the predicted damage to the forest area distribution observed by the 11th National Forest Inventory (NFI11) when the development stages are averaged for the four geographical zones and then used as predictors of the model (Eq. 1 and Table 1) with the different moose population densities. Steps 1–12 indicate the application of the model to future development stages simulated by the European Forestry Dynamics Model (EFDM).