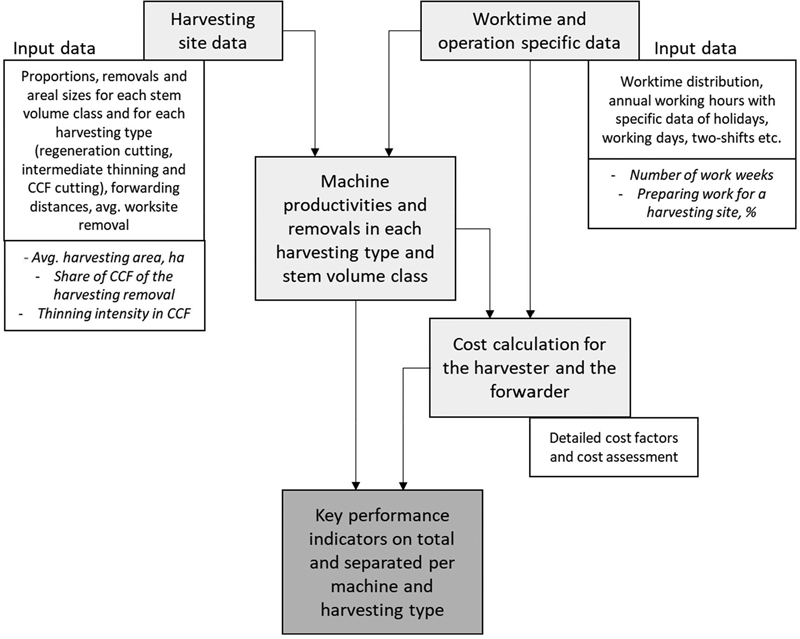
Fig. 1. A flowchart of the systems analysis model framework applied for CTL-harvesting. The parameters subject to particular focus (i.e., the key variables) are presented in italics.
| Table 1. Worktime distributions and working hours of a harvester and a forwarder for a calendar year on a current level (base scenario) for Central Finland province. The shares in percents for each element is calculated against the worktime (i.e., workplace time). | ||
| Harvester | Forwarder | |
| Repairs and maintenance, % | 11.0 | 7.0 |
| Delays due to the operator and planning, % | 4.0 | 4.0 |
| Machine relocations (incl. waiting for relocations), % | 3.0 | 3.1 |
| Preparatory (non-productive) work, % | 2.5 | 0.9 |
| Machine utilization (MUE0) for the productive machine time (E0), % | 79.5 | 85.0 |
| Delays of less than 15 mins, % | 6.0 | 4.0 |
| Machine utilization (MUE15) for the productive machine time* (E15), % | 85.5 | 89.0 |
| Worktime (i.e., workplace time), h | 2881 | 2734 |
| Productive machine time, h15 | 2462 | 2435 |
| Productive machine time, h0 | 2289 | 2326 |
| * Including delays, which duration is less than 15 minutes | ||
| Table 2. Harvester productivity models of Eriksson & Lindroos (2014) used in the systems analysis model of CTL harvesting. Models are for Ln(y), where y = productivity in m3 PMh–1. (RMSE2)/2 is required to add to the model when estimating y. | ||
| Variable | Parameter estimates | |
| Final cutting | Thinning & CCF-cutting | |
| Intercept | 3.135 | 3.592 |
| Ln(Mean stem size) | 0.378 | 0.693 |
| Ln(Total harvested volume) | 0.066 | 0.037 |
| Ln(Harvested volume per ha) | 0.056 | 0.039 |
| (Ln(Mean stem size))2 | –0.072 | - |
| (RMSE2)/2 | 0.0365 | 0.0313 |
| Table 3. Forwarder productivity models of Eriksson & Lindroos (2014) used in the SA-model of CTL harvesting. Models are for Ln(y), where y = productivity in m3 PMh–1. (RMSE2)/2 is required to add to the model when estimating y. MFD = Mean forwarding distance. | ||
| Variable | Parameter estimates | |
| Final cutting | Thinning & CCF-cutting | |
| Intercept | 0.641 | 2.318 |
| (Ln(MFD))2 | –0.056 | –0.028 |
| Ln(Mean stem size) | 0.176 | 0.259 |
| Ln(MFD × Load capacity) | 0.435 | 0.149 |
| Ln(Total harvested volume) | 0.058 | 0.046 |
| Ln(Harvested volume per ha) | 0.094 | 0.074 |
| Ln(Terrain roughness × Slope) | –0.074 | –0.050 |
| (RMSE2)/2 | 0.0392 | 0.0365 |
| Table 4. Main costing parameters and values for the harvester and forwarder in the systems analysis model of CTL-harvesting. | ||
| Harvester | Forwarder | |
| Investment costs and capital factors | ||
| Base machine (excluding equipment), € | 421 000 | 336 000 |
| Soft soil gear, € | 52 000 | 52 000 |
| Harvester head, € | 60 000 | |
| Other equipment, € | 9000 | 14 000 |
| Working capital, € | 30 000 | 20 000 |
| Life span (base machine; fixed), years | 5 | 7 |
| Life span (equipment; varying), hours | 7000 | 7000 |
| Annual depreciation, % | 15 | 15 |
| Labour costs | ||
| Wage cost for base shift, €/h | 17.0 | 15.3 |
| Wage cost for weekend/extended shift, €/h | 25.5 | 22.9 |
| Indirect wage cost, % | 53.25 | 53.25 |
| Kilometre allowance for machine operators, €/km | 0.53 | 0.53 |
| Daily allowance for machine operators, €/day on average | 6 | 6 |
| Operational factors and costs | ||
| Fuel, l/h (consumption) - €/l (price) | 16.0–1.29 | 13.0–1.29 |
| Engine oil, l/h (consumption) - €/l (price) | 0.1–2.50 | 0.1–2.50 |
| Ad-blue, l/h (consumption) - €/l (price) | 0.7–1.29 | 0.6–1.29 |
| Gear oil, l/h (consumption) - €/l (price) | 0.1–3.06 | 0.1–3.06 |
| Hydraulic oil, l/h (consumption) - €/l (price) | 0.2–3.06 | 0.2–3.06 |
| Chainsaw oil, l/h (consumption) - €/l (price) | 0.57–1.77 | - |
| Colour mark, l/h (consumption) - €/l (price) | 0.3–1.77 | - |
| Rot-stop fluid, l/h (consumption) - €/l (price) | 0.56–1.77 | - |
| Chainsaw, pc./h (consumption) - €/kpl (price) | 0.06–16.94 | - |
| Sawbar, pc./h (consumption) - €/kpl (price) | 0.020–52.42 | - |
| Machine relocation, €/km | 2.35 | 2.35 |
| Fixed costs | ||
| Interest rate, % | 4 | 4 |
| Insurances, €/year, a | 2600 | 1800 |
| Real estate expenses, €/a | 4000 | 4000 |
| Administration and maintenance, €/a | 4000 | 4000 |
| Supervision of work and site visits, €/a | 6000 | 3500 |
| Operating margin, % | 5 | 5 |
| Table 5. Proportionate changes (%) in the four key variables in the three impact scenarios of EU’s forest-related policy changes on the operating environment of harvesting entrepreneurs (Low-, Moderate- and High-impact). Proportions are expressed as relative to the status quo, %. Negative values indicate a decrease and positive values an increase relative to the current level. For the share of CCF, the percentages illustrate the level, not a proportionate change. | |||
| Key variable | Low | Moderate | High |
| Size of an average harvesting site1) | –10% | –20% | –30% |
| share of CCF-cutting2) | 10% | 20% | 30% |
| number of working weeks3) | –7% | –15% | –21% |
| total preparatory work for a harvesting site4) | +50% | +100 % | +150% |
| 1) expressed in cutting volume, m3, 2) the share of CCF is currently ca. 2% of total cutting removals (the increase from the 2% level to 10% corresponds to a 400%, from 2% to 20% a 900% and from 2% to 30% a 1400% proportionate increase). The change in this variable will have an additional effect on the removal of harvesting site, 3) current level is 43 weeks, and 7% decrease corresponds to 40, 15% decrease to 37 and 21% decrease to 34 weeks, 4) preparatory work consists of e.g., administrative actions and checking environmental issues on site (note that current level of preparatory work represents 1.0% of the total working time of the harvester and 0.2% of the forwarder). | |||
| Table 6. Regional differences in harvesting conditions, Regions 1, 2 and 3. | |||
| Region 1 | Region 2 | Region 3 | |
| Share of total accumulation by harvesting types1), %; | 70-28-2 | 63-36-2 | 65-33-2 |
| Average stem size, dm3 | 168 | 198 | 242 |
| Average removal, m3 ha–1 | 104 | 109 | 108 |
| Average forwarding distance in RF, m | 287 | 265 | 297 |
| Average forwarding distance in thinning and CCF-cutting, m | 321 | 286 | 364 |
| Average stand size, m3 | 484 | 628 | 580 |
| Average harvesting site removal, m3 | 411 | 534 | 493 |
| 1) RF – thinning - CCF. For instance, in Region 1, 70% of total accumulated removal was from final cuttings, 28% from thinnings and 2% from CCF-cuttings. | |||
| Table 7. Alternative parameter values associated with the key variables in the sensitivity analysis of the systems analysis model of CTL-harvesting. | ||
| Key variable | Current variable value | Alternative variable values |
| Size of the average harvesting site1) | 411–534 m3 | –10%, –20%, –30% and –40% |
| share of CCF2) | 2% | 5%, 10%, 20%, 40% and 60% |
| harvesting intensity in CCF3) | 50% | 30%, 40%, 60% and 70% |
| number of working weeks | 43 weeks | 31, 34, 37 and 40 weeks |
| Increase in preparatory work for a harvesting site4)5) | 1% for a harvester 0.2% for a forwarder | +50%, +100% and +150% |
| 1) average harvesting site removal relative to present level; note that the absolute harvesting site varies between the three regions and that size represents an average working site including one relocation of logging machines, 2) proportion of total cutting volume (m3), %, 3) harvesting intensity expressed as number of removed stems per hectare compared to removed stems in final cutting in RF, %, 4) expressed in proportionate increase relative to current parameter value, %. 5) In each SA-model run, 0.6 h and 0.25 h per each harvested worksite was added to the preparatory work presented above for the harvester and forwarder, respectively. | ||
| Table 8. Annual performance indicator values of the two-machine system (TMS) derived from the systems analysis model of CTL-harvesting for all scenarios (Current state, Low-, Moderate- and High-impact). Presented values are averages of the scenario analysis from the three regions. | ||||
| Annual performance indicators | Current state | Low | Moderate | High |
| Production, m3 | 40 448 | 39 342 | 37 506 | 34 525 |
| Productive machine hours, E15* | ||||
| - harvester | 2446 | 2410 | 2332 | 2180 |
| - forwarder | 2483 | 2460 | 2396 | 2255 |
| Machine utilization (MUE15), % | ||||
| - harvester | 84.9 | 83.6 | 82.2 | 80.5 |
| - forwarder | 88.6 | 87.9 | 87.0 | 85.9 |
| Average productivity, m3/hE15–2* | ||||
| - harvester | 16.5 | 16.3 | 16.1 | 15.8 |
| - forwarder | 16.3 | 16.0 | 15.6 | 15.3 |
| Total harvesting area, ha | 377 | 385 | 389 | 378 |
| Average removal of a logging site, m3 | 479 | 407 | 337 | 276 |
| Number of logging sites | 85 | 98 | 113 | 127 |
| * E15-time corresponds productive machine time (PMh-time) including delays, which duration is less than 15 minutes. | ||||
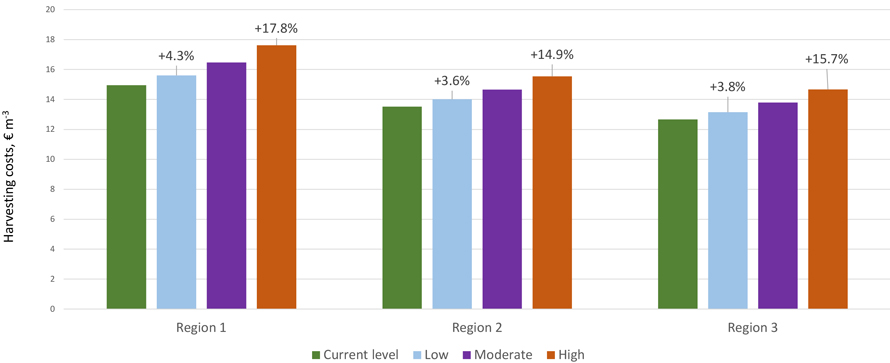
Fig. 2. Harvesting costs according to alternative scenarios and current level of legislation in three different regions of Finland: Region 1 (consisting of the provinces of Ostrobothnia, South and Central Ostrobothnia), Region 2 (Central Finland province) and Region 3 (provinces of South Savo, South Karelia and Kymenlaakso), € m–3. Percentages above the bars illustrate proportionate changes to current level. View larger in new window/tab.
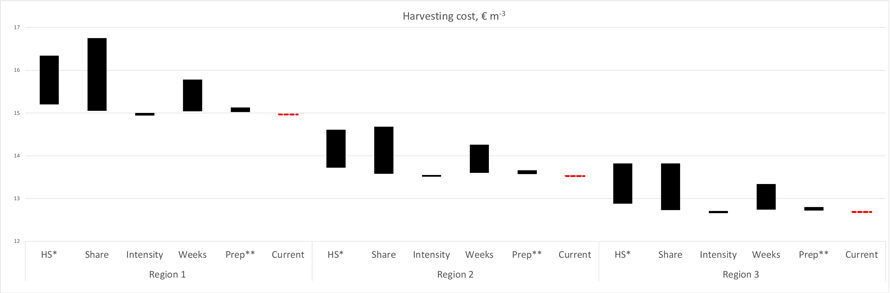
Fig. 3. Results of the sensitivity analysis of the systems analysis model of CTL-harvesting in Region 1, 2 and 3. The floating bars represent the variation according to the alternative variable values presented in Table 7. Red dotted lines illustrate harvesting cost associated with the current level of the key variables in each Region. HS stands for Harvesting site, Share for share of CCF, Intensity for intensity of CCF, Weeks for Working weeks, Prep for Preparatory work and Current for current level. [*Decrease in harvesting site, %, and ** increase in preparatory work – see Table 7 for details]. View larger in new window/tab.