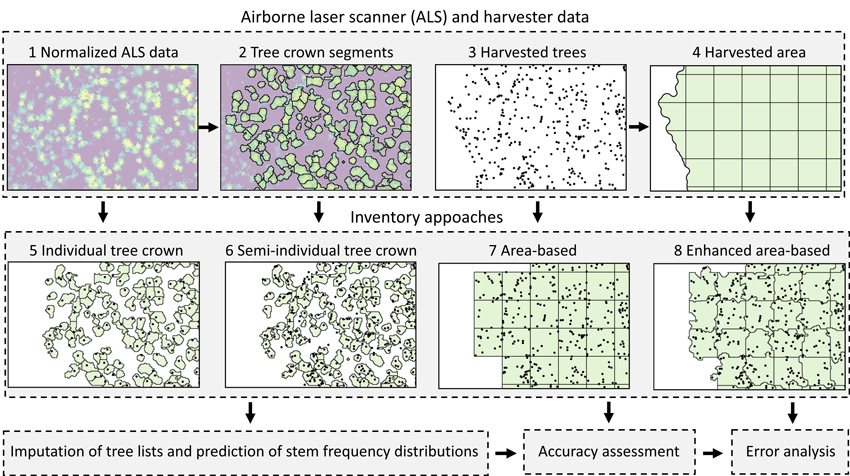
Fig. 1. Study design to compare four inventory approaches for imputing stand-level distributions of stem diameter, tree height, volume and sawn wood volume using harvester and ALS data. We assessed the accuracies of the approaches by comparing the imputed distributions with reference distributions recorded by the harvester, as well as stand mean values. We further assessed which factors influenced the obtained errors.
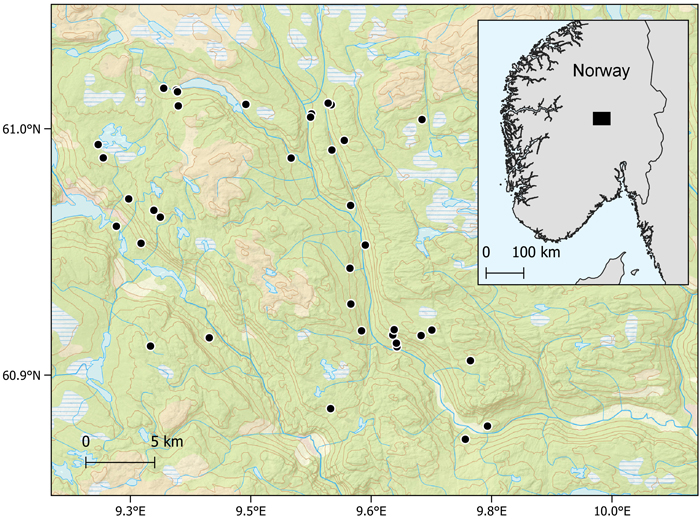
Fig. 2. Locations of harvesting operations in Norway.
| Table 1. Summary statistics (mean and range) of stem diameters, tree heights predicted with taper models, volumes (over bark), and sawnwood volumes (over bark) of harvested trees. | |||||
| Species | n | Stem diameter (cm) | Height (m) | Volume (dm3) | Sawnwood volume (dm3) |
| Spruce | 91 237 | 19.5 (5.1–64.0) | 14.9 (2.1–49.9) | 301 (5–4906) | 92 (0–3559) |
| Pine | 7236 | 27.0 (5.3–58.4) | 18.8 (4.8–50) | 603 (14–3602) | 310 (0–2354) |
| Deciduous | 3336 | 16.3 (5.7–63.5) | 14.8 (4.7–53) | 179 (11–4635) | 0 (0–514) |
| Table 2. Airborne laser scanning acquisition parameters, footprint diameters and mean pulse densities. | ||||||||
| Year | Instrument | Time period | Pulse rate (kHz) | Scan rate (Hz) | Flying altitude (m) | Scanning angle (±°) | Footprint diameter (m) | Pulse density (m–2) |
| 2013 | TopEye S/N 444 | May–July | 200 | 92 | 1500 | 20 | 0.28 | 16.4 |
| 2016 | Riegl LMS Q-1560 | September | 400 | 100 | 2900 | 20 | 0.25 | 5.1 |
| 2017 | Riegl VQ-1560 I | July | 700 | 240 | 2300 | 20 | 0.58 | 9.7 |
| 2019 | Leica ALS70-HP | August | 495 | 69 | 1150 | 16 | 0.73 | 29.6 |
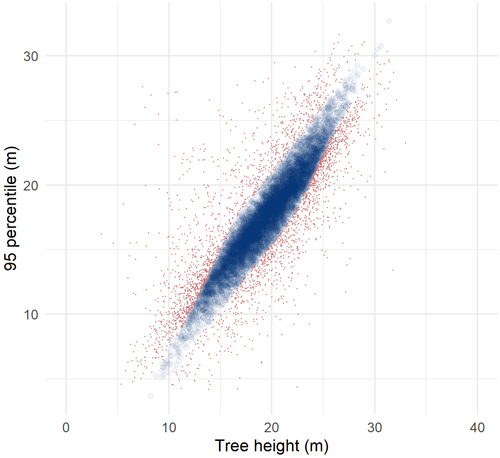
Fig. 3. Heights of harvested trees plotted against the 95 percentile of laser echo heights for observations in the reference data used for an example fold and the individual tree crown approach. Observations used as reference data in the imputation are shown as transparent blue circles and observations labeled as erroneous are shown as red dots.
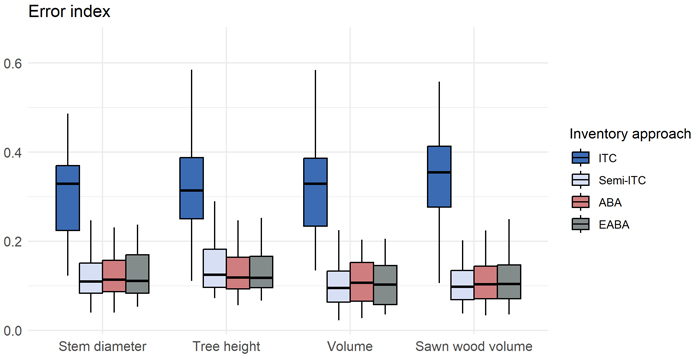
Fig. 4. Box plot of error indices obtained for stand-level imputed distributions of the studied attributes, obtained for the four inventory approaches: individual tree crown (ITC), semi-ITC, area-based approach (ABA) and enhanced ABA.
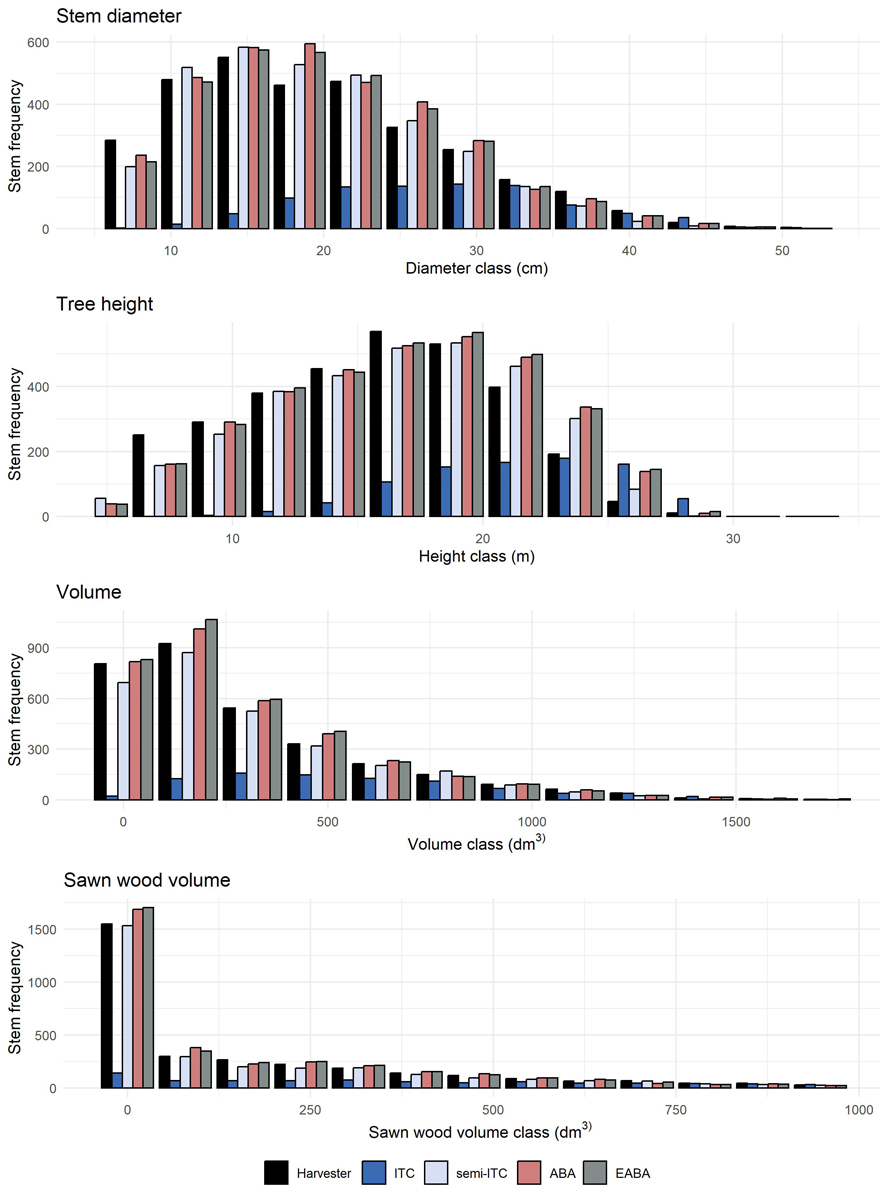
Fig. 5. Imputed stem frequency distributions obtained for a representative example stand, i.e., with an error index nearest to the mean error index obtained for all stands, recorded by the harvester and imputed using the four inventory approaches: individual tree crown (ITC), semi-ITC, area-based approach (ABA) and enhanced ABA (EABA).
| Table 3. Errors obtained for estimates of stand-level forest attributes, as root mean square errors and mean differences relative to the observed mean values (RMSE%, MD%), for the four inventory approaches: individual tree crown (ITC), semi-ITC, area-based approach (ABA) and enhanced ABA (EABA). | ||||||||
| ITC | Semi-ITC | ABA | EABA | |||||
| RMSE% | MD% | RMSE% | MD% | RMSE% | MD% | RMSE% | MD% | |
| Stem diameter (cm) | 30.1 | –24.4 | 14.6 | 5.7 | 14.6 | 4.7 | 15.2 | 4.9 |
| Height (m) | 22.2 | –18.0 | 9.1 | 3.6 | 8.9 | 1.8 | 8.7 | 1.2 |
| Volume (m3 ha–1) | 66.9 | 52.5 | 13.6 | 3.1 | 19.0 | 1.7 | 16.6 | 2.8 |
| Sawn wood volume (m3 ha–1) | 65.0 | 42.9 | 19.7 | 2.5 | 21.2 | 3.1 | 21.3 | 2.0 |
| Number of stems (ha–1) | 75.3 | 70.6 | 17.4 | –2.7 | 22.1 | –3.9 | 21.7 | –5.1 |
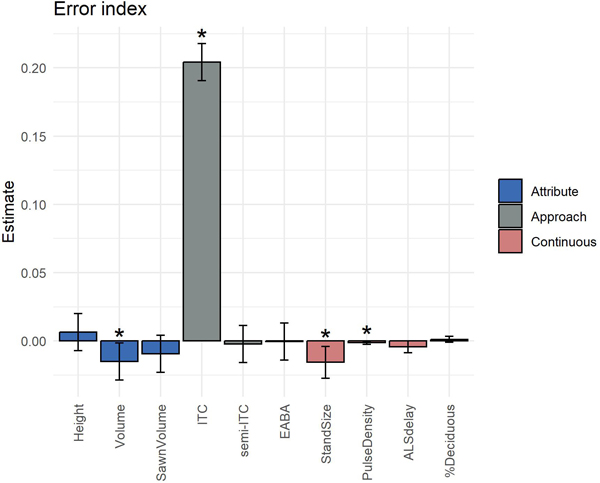
Fig. 6. Parameter estimates (bars) and 95% confidence intervals (whiskers) obtained for the fitted model used in the error analysis. Variables that significantly influenced the obtained error indices (p < 0.05) are labeled with an asterisk.