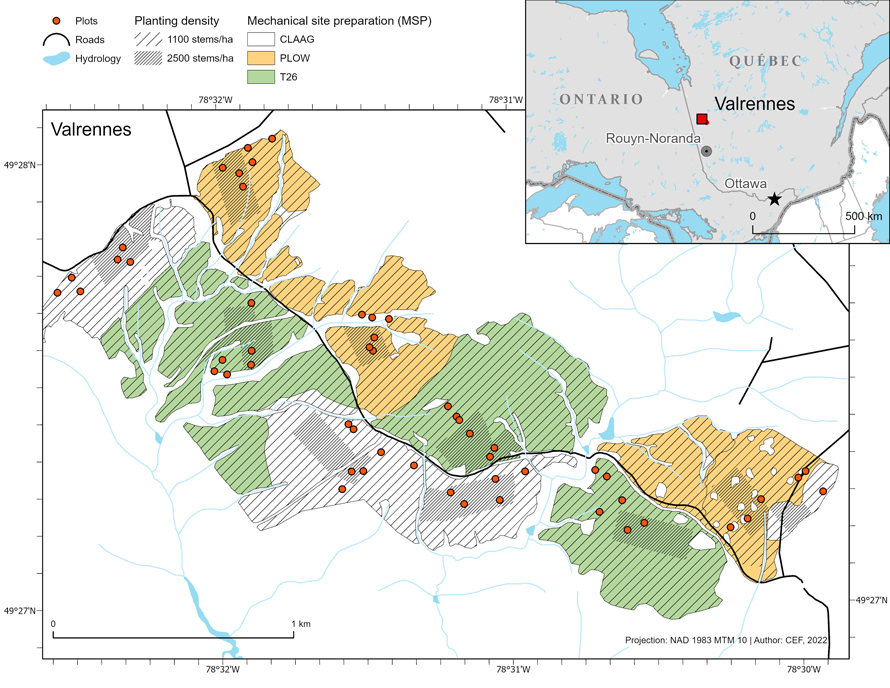
Fig. 1. Location of the study region and experimental site in Quebec (Canada), showing the distribution of the silvicultural treatments (careful logging around advanced growth (CLAAG), plowing and T26 scarification) with location of the low (1100 seedlings ha–1) and high (2500 seedlings ha–1) planting density of black spruce (Picea mariana) areas within each site. View larger in new window/tab.
| Table 1. Results from linear mixed model for the main and interacting effects of planting density of black spruce (Picea mariana) and mechanical site preparation on environmental conditions and understory diversity. Df = degrees of freedom. Bold indicates significance at α ≤ 0.05. | ||||||
| Response variable | Treatment effects | |||||
| Planting density | Mechanical site preparation (MSP) | Planting density × MSP | ||||
| Df | p-value | Df | p-value | Df | p-value | |
| Environmental conditions | ||||||
| Conifer density (stems ha–1) | 1 | 0.28 | 2 | 0.02 | 2 | 0.87 |
| Deciduous species density (stems ha–1) | 1 | 0.56 | 2 | 0.036 | 2 | 0.3 |
| Shrub density (stems ha–1) | 1 | 0.55 | 2 | 0.65 | 2 | 0.05 |
| Vegetation cover (%) | 1 | 0.5 | 2 | 0.01 | 2 | 0.96 |
| C/N ratio | 1 | 0.003 | 2 | <0.001 | 2 | 0.3 |
| Understory diversity | ||||||
| Vascular plant dominance (Simpson index) | 1 | 0.3 | 2 | 0.9 | 2 | 0.65 |
| Vascular plant diversity (Shannon index) | 1 | 0.07 | 2 | 0.91 | 2 | 0.09 |
| Bryophyte cover (%) | 1 | 0.002 | 2 | 0.11 | 2 | <0.001 |
| Bryophyte diversity (Shannon-Wiener index) | 1 | 0.15 | 2 | 0.2 | 2 | 0.46 |
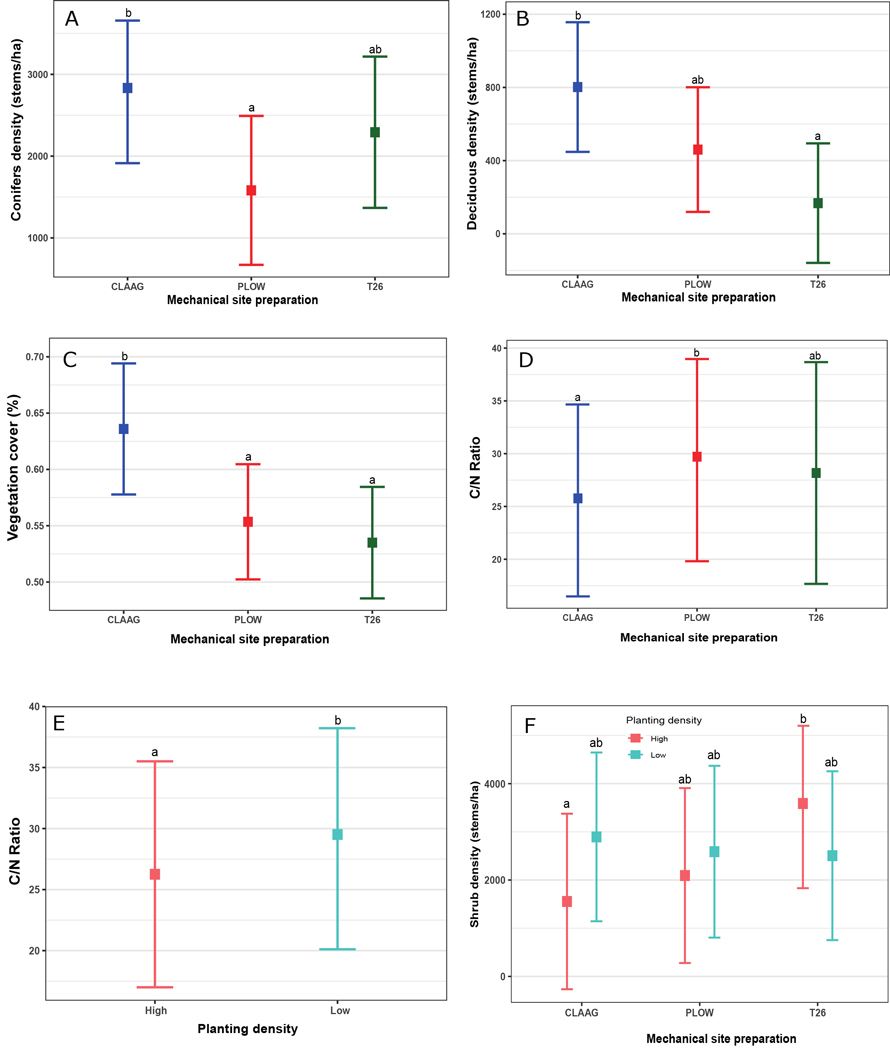
Fig. 2. Effects of planting density of black spruce (Picea mariana) (Low = 1100 seedlings ha–1; High = 2500 seedlings ha–1) and mechanical site preparation (CLAAG = careful logging around advanced growth; Plow = plowing; T26 = disk trenching scarification) on naturally regenerated conifer density (A), deciduous species density (B); vegetation cover (C); and soil C/N ratio (D, E). Panel F illustrates the interacting effects of mechanical site preparation and planting density on shrub density. Data are presented as estimated marginal means with 95% confidence intervals. Means followed by the same letter are not significatively different at α ≤ 0.05 based on linear mixed models with Tukey HSD pairwise comparisons. (Plots CLAAG low, n = 32; plots CLAAG high, n = 25; plots Plow low, n = 30; plots Plow high, n = 29; plots T26 low, n = 34; plots T26 high, n = 30). View larger in new window/tab.
| Table 2. Influence of planting density of black spruce (Picea mariana) and mechanical site preparation and their interaction on vascular plant and bryophytes dissimilarity using permutational multivariate analysis of variance (Permanova) based on the Bray–Curtis dissimilarity index. Df = degrees of freedom. Bold indicates significance at α ≤ 0.05. SS = sum of squares. | ||||||
| Assemblage | Treatment | Df | SS | F | R2 | p-value |
| Vascular plant | Planting density | 1 | 0.33 | 1.24 | 0.011 | 0.316 |
| Mechanical site preparation (MSP) | 2 | 2.13 | 4.02 | 0.07 | 0.001 | |
| Planting × MSP | 2 | 0.84 | 1.58 | 0.02 | 0.048 | |
| Residual | 98 | 25.9 | 0.89 | |||
| Bryophytes | Planting density | 1 | 0.63 | 2.83 | 0.026 | 0.036 |
| Mechanical site preparation (MSP) | 2 | 0.81 | 1.81 | 0.034 | 0.008 | |
| Planting × MSP | 2 | 1.14 | 2.56 | 0.048 | 0.016 | |
| Residual 1 | 94 | 21.10 | 0.89 | |||
| 1 four plots without bryophytes | ||||||
| Table 3. Results from post-hoc pairwise tests for vascular plant and bryophytes between mechanical site preparation treatments after planting of black spruce (Picea mariana) (CLAAG = careful logging around advanced growth; Plow = plowing; T26 = disk trenching scarification; High = planting density of 2500 seedlings ha–1; Low = planting density of 1100 seedlings ha–1). Df = degrees of freedom; SS = sum of squares. Bold indicates significance at α = 0.05. | |||||||||
| Pairs | Df | SS | F | R2 | p-value | adjusted p | |||
| Vascular plants | |||||||||
| CLAAG | vs | PLOW | High | 1 | 1.01 | 3.97 | 0.12 | 0.001 | 0.005 |
| CLAAG | vs | T26 | High | 1 | 0.49 | 2.15 | 0.07 | 0.019 | 0.038 |
| PLOW | vs | T26 | High | 1 | 0.51 | 2.05 | 0.06 | 0.030 | 0.005 |
| CLAAG | vs | PLOW | Low | 1 | 0.64 | 2.16 | 0.05 | 0.012 | 0.035 |
| CLAAG | vs | T26 | Low | 1 | 0.47 | 1.74 | 0.04 | 0.083 | 0.13 |
| PLOW | vs | T26 | Low | 1 | 1.27 | 4.74 | 0.11 | 0.001 | 0.006 |
| Bryophytes | |||||||||
| CLAAG | vs | PLOW | High | 1 | 0.76 | 3.12 | 0.10 | 0.028 | 0.1 |
| CLAAG | vs | T26 | High | 1 | 1.29 | 6.33 | 0.18 | 0.002 | 0.02 |
| PLOW | vs | T26 | High | 1 | 0.20 | 0.71 | 0.02 | 0.605 | 0.68 |
| CLAAG | vs | PLOW | Low | 1 | 0.18 | 0.75 | 0.02 | 0.564 | 0.64 |
| CLAAG | vs | T26 | Low | 1 | 0.08 | 0.47 | 0.01 | 0.658 | 0.7 |
| PLOW | vs | T26 | Low | 1 | 0.42 | 2.08 | 0.05 | 0.090 | 0.26 |
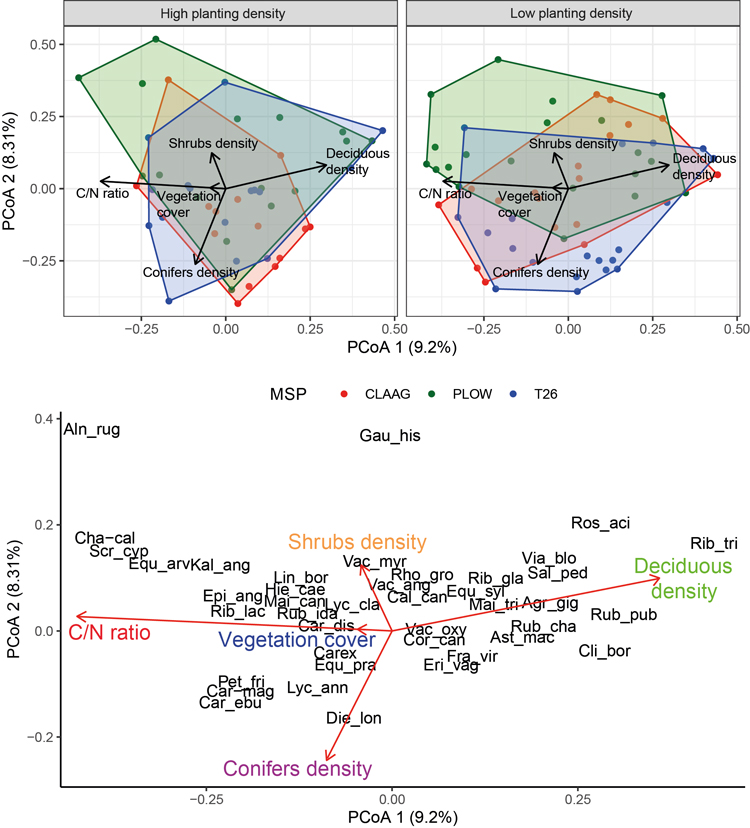
Fig. 3. Principal coordinates analysis (PCoA) for the vascular plant composition using the Bray-Curtis dissimilarity index and a Cailliez correction. Species names and environmental conditions were added by correlation to the axes. Colors in convex hull indicate different mechanical site preparation (MSP) treatments. See Supplementary file S1 for full species names.
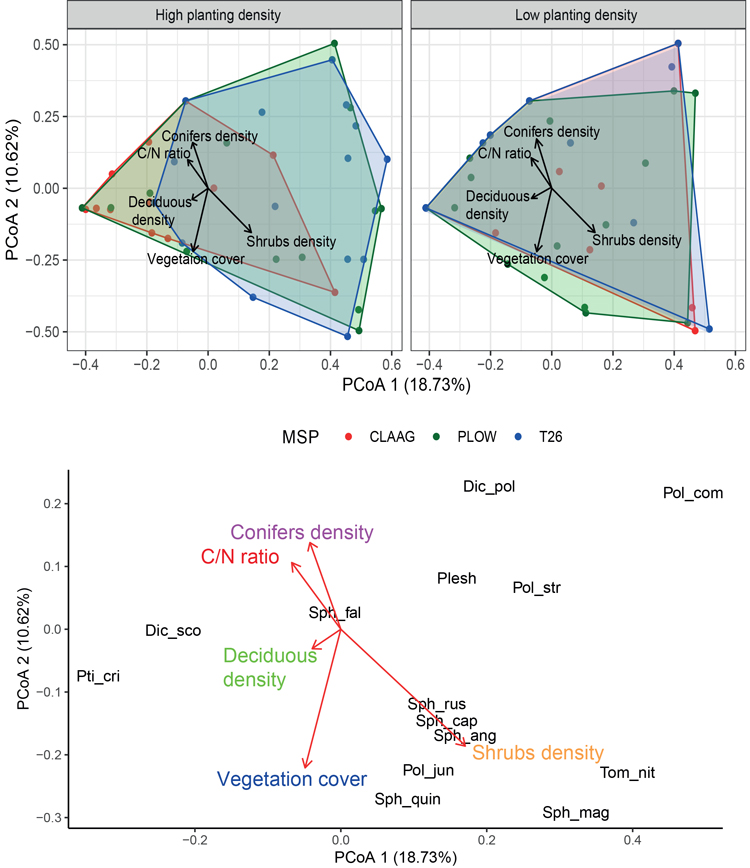
Fig. 4. Principal coordinates analysis (PCoA) for the bryophyte composition using the Bray-Curtis dissimilarity index and a Cailliez correction. Species names and environmental conditions were added by correlation to the axes. Colors in convex hull indicate different mechanical site preparation (MSP) treatments. See Suppl. file S1 for full species names.
| Table 4. Results from linear mixed model for the main and interacting effects of planting density of black spruce (Picea mariana) and mechanical site preparation on functional trait of vascular plant and bryophytes. Df = degrees of freedom. Bold indicates significance at α ≤ 0.05. | ||||||
| Response variable | Treatment effect | |||||
| Planting density | Mechanical site preparation (MSP) | Planting density × MSP | ||||
| Df | p-value | Df | p-value | Df | p-value | |
| Functional trait of bryophytes | ||||||
| Water content at field capacity (%) | 1 | 0.77 | 2 | 0.02 | 2 | 0.5 |
| Colony density (mg cm–3) | 1 | 0.93 | 2 | 0.51 | 2 | 0.09 |
| Absorption capacity (ml cm–3) | 1 | 0.13 | 2 | 0.86 | 2 | 0.16 |
| Percolation (% cm –3) | 1 | 0.74 | 2 | 0.95 | 2 | 0.58 |
| Functional trait of vascular plants | ||||||
| Maximum height (cm) | 1 | 0.86 | 2 | 0.91 | 2 | 0.09 |
| Specific leaf area (cm2 g–1) | 1 | 0.93 | 2 | 0.43 | 2 | 0.14 |
| Small shrubs abundance | 1 | 0.55 | 2 | 0.05 | 2 | 0.055 |
| Herbaceous abundance | 1 | 0.01 | 2 | 0.7 | 2 | 0.84 |
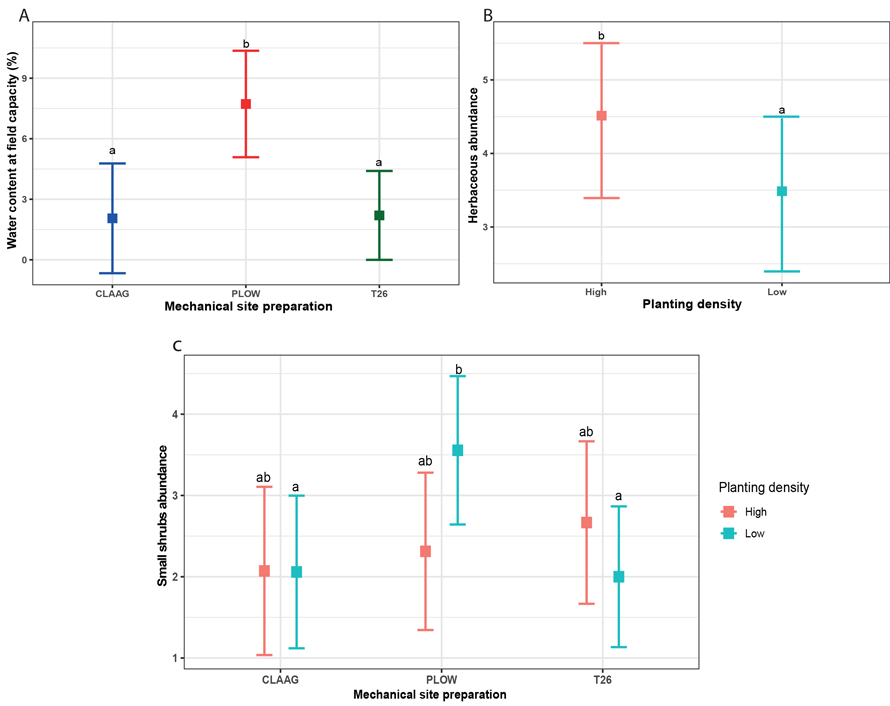
Fig. 5. Effects of planting density of black spruce (Picea mariana) (Low = 1100 seedlings ha–1; High = 2500 seedlings ha–1) and mechanical site preparation (CLAAG = careful logging around advance growth; Plow = plowing; T26 = disk trenching scarification) on water content at field capacity and the herbaceous abundance (A, B). Panel C illustrates the interacting effects of mechanical site preparation and planting density on the small shrubs abundance. Data are presented as estimated marginal means with 95% confidence intervals. Means followed by the same letter are not significatively different at α ≤ 0.05 based on linear mixed models with Tukey HSD pairwise comparisons. (Plots CLAAG low, n = 18; plots CLAAG high, n = 14; plots Plow low, n = 20; plots Plow high, n = 16; plots T26 low, n = 20; plots T26 high, n = 16). View larger in new window/tab.
| Table 5. Results from linear mixed model for the main and interacting effects of planting density of black spruce (Picea mariana) and mechanical site preparation on height, growth, diameter at ground level, N and C foliar concentration of planted trees. Df = degrees of freedom. Bold indicates significance at α ≤ 0.05. | ||||||
| Response variable | Treatment effect | |||||
| Planting density | Mechanical site preparation (MSP) | Planting density × MSP | ||||
| Df | p-value | Df | p-value | Df | p-value | |
| Height trees measured in 2020 (cm) | 1 | 0.32 | 2 | 0.75 | 2 | 0.47 |
| Diameter at ground-level (mm) | 1 | 0.6 | 2 | 0.35 | 2 | 0.42 |
| Sapling growth measured between 2016–2020 (cm) | 1 | 0.89 | 2 | 0.88 | 1 | 0.03 |
| N foliar % | 1 | 0.88 | 2 | 0.02 | 2 | 0.29 |
| C foliar % | 1 | 0.2 | 2 | 0.001 | 2 | <0.001 |
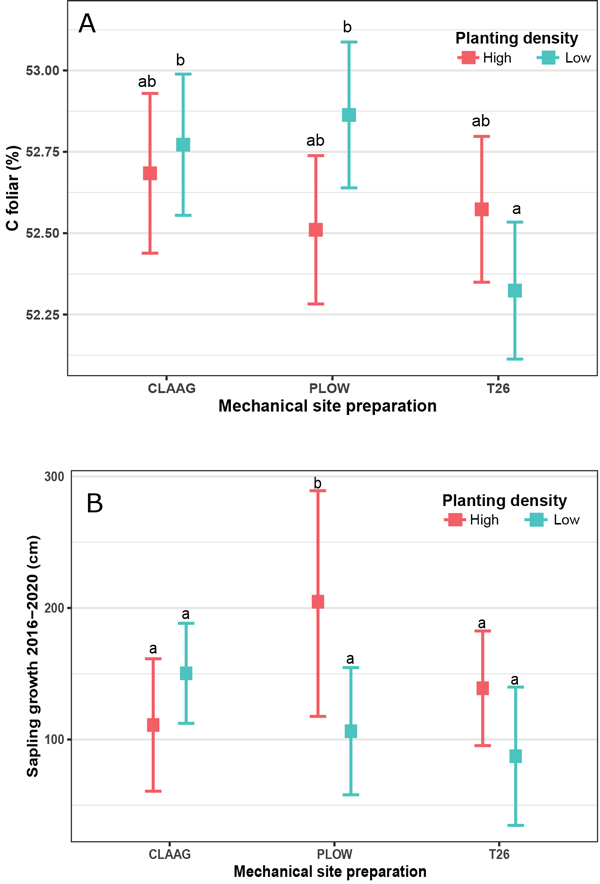
Fig. 6. Effects of planting density of black spruce (Picea mariana) (Low = 1100 seedlings ha–1; High = 2500 seedlings ha–1) and mechanical site preparation (CLAAG = careful logging around advanced growth; Plow = plowing; T26 = disk trenching scarification) on foliar C concentration (A) and on sapling growth (B). Data are presented as estimated marginal means with 95% confidence intervals. Means followed by the same letter are not significatively different at α ≤ 0.05 based on linear mixed models with Tukey HSD pairwise comparisons. (Plots CLAAG low, n = 32; plots CLAAG high, n = 25; plots Plow low, n = 30; plots Plow high, n = 29; plots T26 low, n = 34; plots T26 high, n = 30).