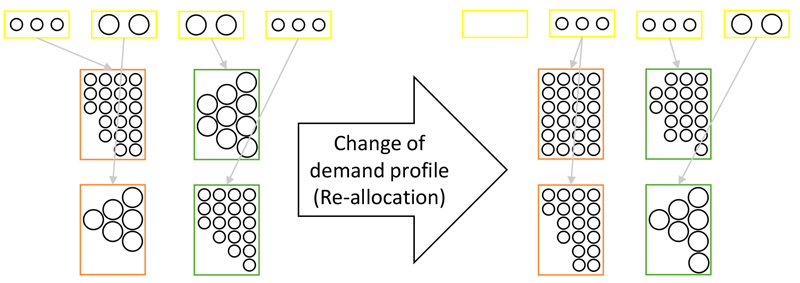
Fig. 1. Different box assignments resulting in the re-allocation of boxes in response to a schematically depicted change in demand profile (ejection boxes in yellow, storage boxes for 4-metre logs in orange and for 5-metre logs in green).
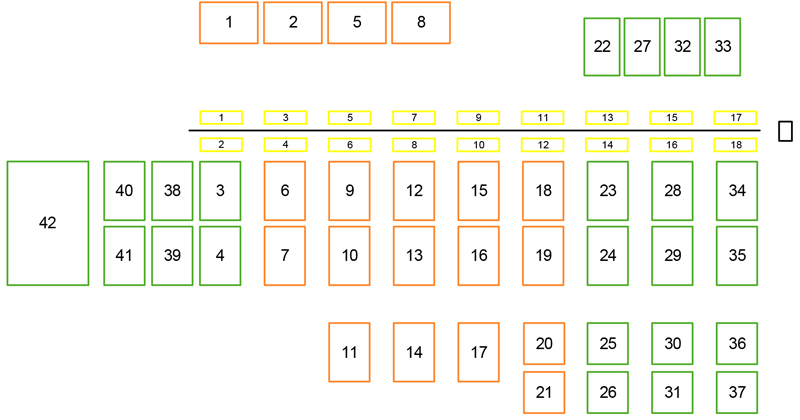
Fig. 2. Layout of the log yard with ejection boxes (yellow), along the sorting line, and storage boxes (orange and green), whereby the orange boxes have a width of 4 metres and the green boxes are suited for 5-metre long logs. To the right of the sorting line is the material feed (black).
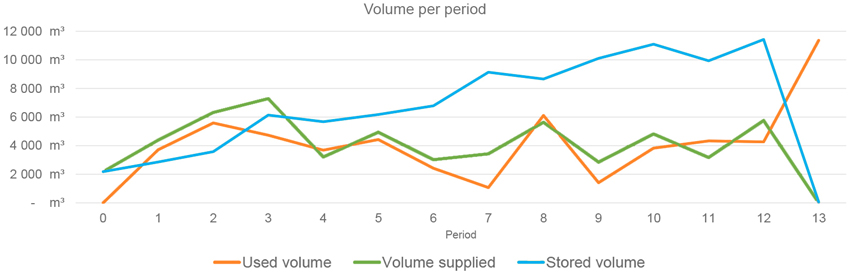
Fig. 3. Changes in inventory at the investigated log yard per planning period for half a year, total supplied volume per planning period (green), total stored volume per planning period (blue) and total used volume per planning period (orange).
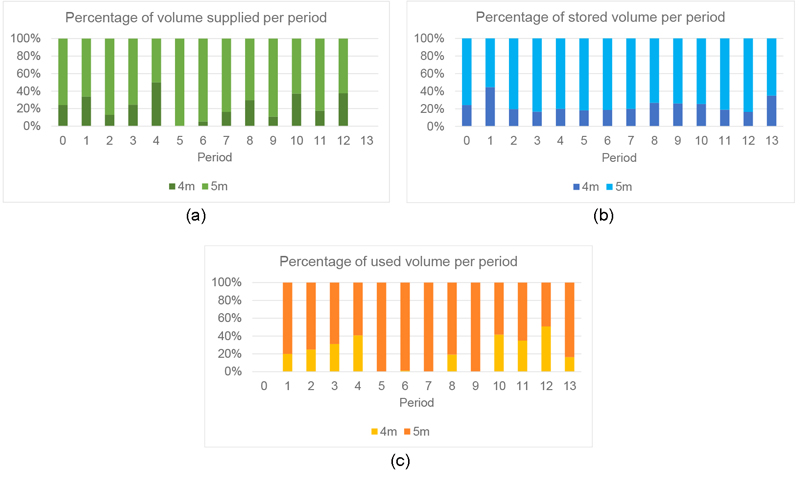
Fig. 4. Percentage distribution of the total volumes of 4- and 5-metre assortments of supplied material (a), stored material (b) and used material (c) per planning period at the log yard.
| Table 1. Minimum, maximum and average of the parameter values for the number of trips and distances in metres. |
| Parameter | Min | Max | Average |
| Na | 7.71 | 12.53 | 9.69 |
| Ds | 45.70 | 250.38 | 149.60 |
| Des | 4.38 | 200.58 | 76.85 |
| Dss′ | 1.50 | 200.03 | 76.65 |
| Table 2. Comparison of transportation distances between the dynamic log yard box assignment problem multi-period optimisation model solution and those derived from the double stage model and period per period optimisation, while also considering capacity variations at the log yard. |
| Available capacity | Multi-period | Double stage | Period per period |
| metre | metre | % | metre | % |
| 100% | 53 203 087 | 57 105 387 | 7 | 61 048 908 | 15 |
| 90% | 54 306 150 | 59 368 512 | 9 | 61 867 595 | 14 |
| 80% | 55 315 550 | 62 079 198 | 12 | 61 195 460 | 11 |
| 70% | - | 62 887 167 | - | 63 412 692 | - |
| 60% | | infeasible | | |
| Table 3. Computation time, in seconds, for multi-period, double stage and period per period planning for the dynamic box assignment problem with reduced available capacity at the log yard. |
| Available capacity | Multi-period | Double stage | Period per period |
| sec | sec | sec |
| 100% | 5662 | 105 | 26 |
| 90% | 2828 | 5199 | 22 |
| 80% | 2086 | 27 713 | 41 |
| 70% | - | 195 994 | 35 |
| Table 4. Average distribution of distances over the three parts of the objective function, transport distances of delivered material from ejection box to storage box, transport distances of used material to the feeder and reallocation distances, over available storage box capacities 100% to 70% and 60% respectively. |
| Objective function | Multi-period | Double stage | Period per period |
| Ejection box to storage box | 12% | 22% | 9% |
| Material feed | 78% | 71% | 80% |
| Re-allocation | 10% | 8% | 11% |
| Table 5. Comparison of the covered distance solution of the dynamic box assignment planning in log yards of the multi-period optimisation model with the double stage model and period per period planning, in which the volume per period remains constant but the number of assortments per period is either doubled or halved. |
| # Assortments | Multi-period | Double stage | Period per period |
| metre | % | metre | % | metre | % |
| ×2 | 60 560 513 | 14 | 66 256 867 | 16 | 65 868 598 | 8 |
| ×1 | 53 203 087 | 0 | 57 105 387 | 0 | 61 048 908 | 0 |
| ×1/2 | 48 407 990 | –9 | 51 362 746 | –10 | 55 840 717 | –9 |
| Table 6. Percentage change in results of covered distance for the dynamic box assignment problem in log yards if 10% volume is allowed to be taken from the storage boxes in addition to the demanded quantity used at the saw. |
| Available capacity | Multi-period | Double stage | Period per period |
| metre | % | metre | % | metre | % |
| 100% | 53 132 715 | –0.13 | 56 432 380 | –1.18 | 60 986 796 | –0.10 |
| 90% | 54 127 494 | –0.33 | 58 741 336 | –1.06 | 61 811 628 | –0.09 |
| 80% | 55 174 836 | –0.25 | 60 271 310 | –2.91 | - | - |
| 70% | 56 614 306 | - | 62 514 704 | –0.59 | - | - |