| Table 1. Characteristics and sample sizes of studied tree species used to examine the variations in wood basic density, carbon (C), and nitrogen (N) concentrations within the discolored and decomposed wood present in the stems of living trees in Latvia. | |||||||
| Species | Number of trees (stands) | Age, years (range) | Diameter at breast height, cm (range) | Tree height, m (range) | Number of discs | Number of basic density samples | Number of C and N samples |
| Betula | 47 (8) | 85 (69–109) | 26.0 (9.5–44.7) | 24.1 (14.7–31.8) | 298 | 704 | 210 |
| Populus tremula | 19 (5) | 74 (69–89) | 37.7 (25.5–53.3) | 31.4 (28.7–33.5) | 276 | 801 | 211 |
| Alnus incana | 38 (9) | 49 (37–70) | 19.3 (14–28.5) | 20.8 (16.3–26) | 196 | 449 | 217 |
| Alnus glutinosa | 32 (7) | 90 (65–122) | 23.3 (13–40) | 23.3 (11.9–28.5) | 242 | 580 | 265 |
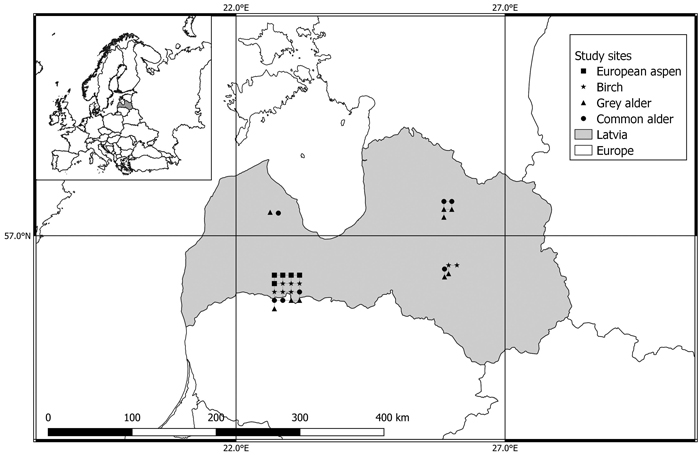
Fig. 1. Location of European aspen (Populus tremula), birch (Betula spp.), grey alder (Alnus incana), and common alder (Alnus glutinosa) study sites used to examine the variations in wood basic density, carbon, and nitrogen concentrations within the decayed wood present in the stems of living trees in Latvia.
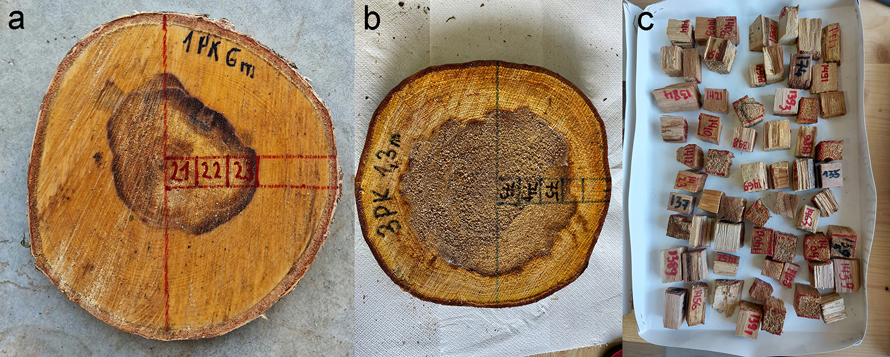
Fig. 2. Position of the specimens within the sample discs: (a) discolored wood; (b) decomposed wood; (c) wood specimens prepared for analyses of basic density.
| Table 2. Type III analysis of variance table with Satterthwaite’s method for the linear mixed-effects model to investigate the effect of wood condition and position of the specimen on wood basic density, carbon (C) and nitrogen (N) content. The table shows the number of degrees of freedom (DF), F-value, and p-value for each term in the model. Numbers in bold are statistically significant. | ||||||||||||
| Fixed effect variables | Betula | Populus tremula | Alnus incana | Alnus glutinosa | ||||||||
| DF | F-value | p-value | DF | F-value | p-value | DF | F-value | p-value | DF | F-value | p-value | |
| Basic density model | R2m(0.61), R2c(0.78) | R2m(0.68), R2c(0.75) | R2m(0.53), R2c(0.80) | R2m(0.37), R2c(0.57) | ||||||||
| Distance from pith | 6.33 | 12.8 | 0.011 | 3.17 | 9.9 | 0.048 | 11.02 | 5.8 | 0.035 | 192.24 | 1.0 | 0.308 |
| Wood condition | 8.78 | 75.1 | <0.001 | 2.18 | 123.4 | 0.006 | 10.82 | 87.9 | <0.001 | 6.40 | 31.8 | 0.001 |
| Distance:Wood condition | 114.59 | 8.0 | 0.006 | 289.59 | 0.6 | 0.425 | 375.90 | 3.4 | 0.067 | 210.65 | 0.1 | 0.725 |
| C content model | R2m(0.12), R2c(0.65) | R2m(0.15), R2c(0.26) | R2m(0.01), R2c(0.33) | R2m(0.37), R2c(0.57) | ||||||||
| Distance from pith | 4.04 | 3.0 | 0.159 | 0.73 | 7.1 | 0.295 | 3.97 | 0.4 | 0.562 | 1.46 | 0.3 | 0.653 |
| Wood condition | 5.90 | 5.4 | 0.059 | 22.15 | 6.3 | 0.020 | 5.60 | 0.1 | 0.808 | 7.23 | 0.2 | 0.641 |
| Distance:Wood condition | 166.43 | 1.3 | 0.260 | 12.29 | 0.3 | 0.570 | 114.65 | 0.3 | 0.595 | 134.17 | 3.2 | 0.076 |
| N content model | R2m(0.44), R2c(0.87) | R2m(0.55), R2c(0.64) | R2m(0.30), R2c(0.62) | R2m(0.28), R2c(0.58) | ||||||||
| Distance from pith | 3.62 | 5.9 | 0.079 | 2.39 | 2.1 | 0.269 | 6.20 | 4.0 | 0.092 | 3.79 | 3.3 | 0.147 |
| Wood condition | 5.51 | 24.8 | 0.003 | 21.08 | 49.7 | <0.001 | 10.33 | 16.0 | 0.002 | 6.38 | 6.5 | 0.041 |
| Distance:Wood condition | 174.27 | 0.1 | 0.817 | 76.12 | 0.1 | 0.714 | 151.29 | 0.2 | 0.693 | 159.18 | 6.0 | 0.015 |
| The interaction between the factors distance from pith and wood condition is represented as “Distance:Wood condition” | ||||||||||||
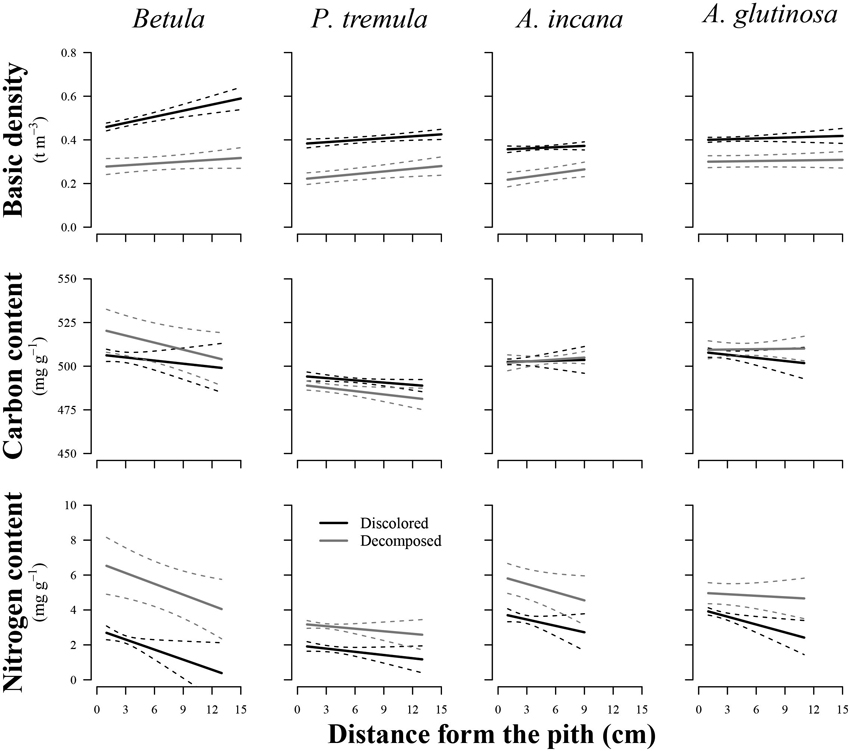
Fig. 3. Effect plots showing differences in basic density, carbon content and nitrogen content across discolored or decomposed wood and distance from pith for different tree species. The area between dotted lines indicates 95% confidence interval.
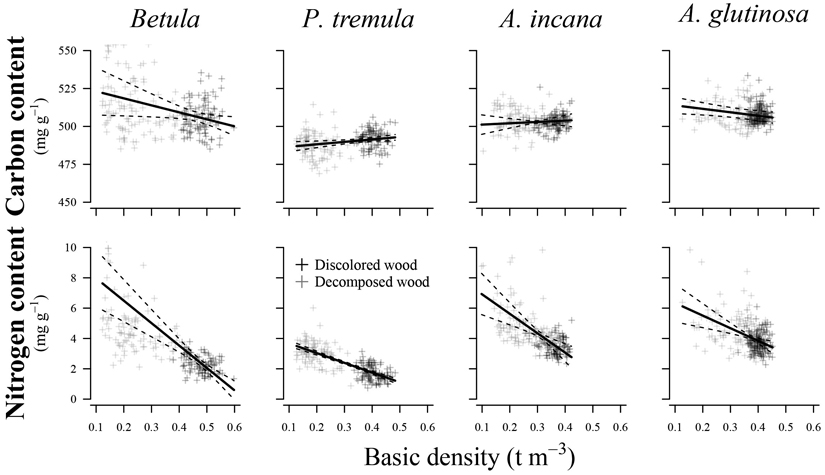
Fig. 4. Effect plots showing differences in carbon and nitrogen content across basic density for different tree species. The area between dotted lines indicates 95% confidence interval.
| Table 3. Type III analysis of variance table with Satterthwaite’s method for the linear mixed-effects model to investigate the effect of basic density on wood carbon (C) and nitrogen (N) content. The table shows the number of degrees of freedom (DF), F-value, and p-value for the model. Numbers in bold are statistically significant. | ||||||||||||
| Fixed effect variable | Betula | Populus tremula | Alnus incana | Alnus glutinosa | ||||||||
| DF | F-value | p-Value | DF | F-value | p-value | DF | F-value | p-value | DF | F-value | p-value | |
| C content model | R2m(0.11), R2c(0.61) | R2m(0.06), R2c(0.17) | R2m(0.01), R2c(0.32) | R2m(0.03), R2c(0.45) | ||||||||
| Basic density | 4.94 | 4.8 | 0.081 | 14.80 | 7.5 | 0.015 | 3.62 | 0.3 | 0.626 | 14.75 | 6.2 | 0.025 |
| N content model | R2m(0.53), R2c(0.86) | R2m(0.60), R2c(0.60) | R2m(0.37), R2c(0.56) | R2m(0.25), R2c(0.45) | ||||||||
| Basic density | 4.94 | 35.4 | 0.002 | 17.32 | 248.9 | <0.001 | 5.19 | 16.1 | 0.009 | 5.15 | 12.8 | 0.015 |
| Table 4. Analysis of estimated marginal means (emmean) and pairwise comparison for wood basic density, carbon content, and nitrogen content of examined species across discolored and decomposed wood. Numbers in bold are statistically significant. | ||||||
| Dependent variables | Species | Wood condition | emmean | Standard error | Pairwise comparison | |
| Mean difference | p-value | |||||
| Basic density, t m–3 | Betula | Discolored wood | 0.480 | 0.010 | 0.196 | <0.0001 |
| Decomposed wood | 0.284 | 0.017 | ||||
| Populus tremula | Discolored wood | 0.394 | 0.008 | 0.157 | 0.0029 | |
| Decomposed wood | 0.237 | 0.016 | ||||
| Alnus incana | Discolored wood | 0.360 | 0.005 | 0.132 | <0.0001 | |
| Decomposed wood | 0.228 | 0.016 | ||||
| Alnus glutinosa | Discolored wood | 0.403 | 0.006 | 0.102 | 0.0011 | |
| Decomposed wood | 0.301 | 0.014 | ||||
| Carbon content, mg g–1 | Betula | Discolored wood | 505.0 | 1.880 | –12.20 | 0.1062 |
| Decomposed wood | 517.0 | 5.860 | ||||
| Populus tremula | Discolored wood | 492.4 | 1.027 | 5.98 | 0.2439 | |
| Decomposed wood | 486.4 | 2.519 | ||||
| Alnus incana | Discolored wood | 503.0 | 1.430 | 0.02 | 0.9938 | |
| Decomposed wood | 503.0 | 1.700 | ||||
| Alnus glutinosa | Discolored wood | 507.0 | 1.350 | –2.90 | 0.2020 | |
| Decomposed wood | 510.0 | 2.090 | ||||
| Nitrogen content, mg g–1 | Betula | Discolored wood | 2.2 | 0.146 | –3.8 | 0.0044 |
| Decomposed wood | 6.0 | 0.728 | ||||
| Populus tremula | Discolored wood | 1.7 | 0.096 | –1.4 | 0.0174 | |
| Decomposed wood | 3.1 | 0.115 | ||||
| Alnus incana | Discolored wood | 3.4 | 0.187 | –2.0 | 0.0171 | |
| Decomposed wood | 5.5 | 0.470 | ||||
| Alnus glutinosa | Discolored wood | 3.6 | 0.137 | –1.3 | 0.015 | |
| Decomposed wood | 4.9 | 0.320 | ||||