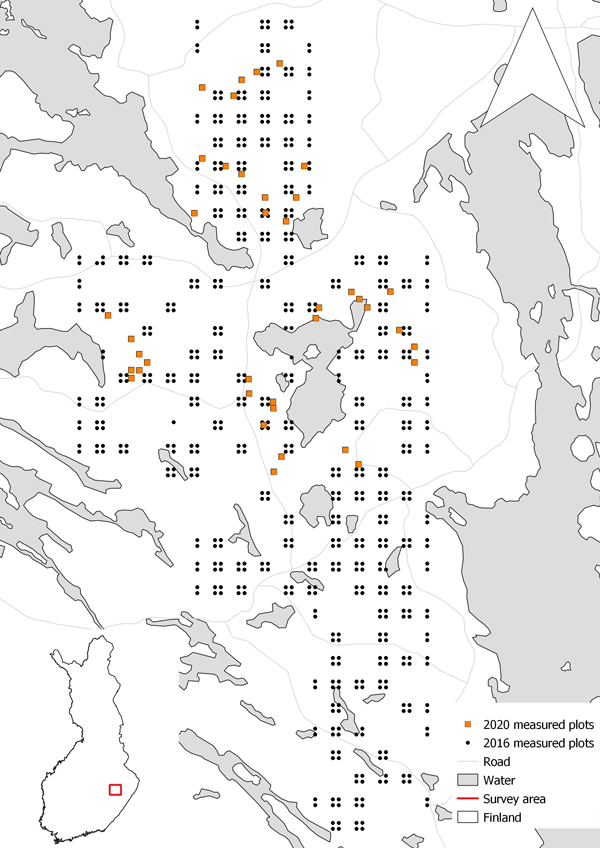
Fig 1. Locations of field plots used in 2016 and 2020. The 2016 data were used for the construction of a general diameter at breast height (DBH) model (Kukkonen et al. 2022) in option 1, and the 2020 data were used in the modelling and calibration of diameter at breast height and calculation of DBH in options 2 and 3.
| Table 1. Descriptive statistics of the plot attribute data used in the modelling and calibration of diameter at breast height (DBH) and the calculation of the diameter of the basal area median tree (DGM) and volume. | ||||
| Average | Minimum | Maximum | Standard deviation | |
| DGM (cm) | 23.7 | 13.3 | 39.5 | 7.3 |
| Basal area (m2 ha–1) | 24.9 | 10.7 | 42.2 | 7.8 |
| Stem count (N ha–1) | 994.9 | 266.7 | 2155.6 | 515.5 |
| Height of the basal area median tree (m) | 21.1 | 8.8 | 30.0 | 5.5 |
| Volume (m3 ha–1) | 240.5 | 83.0 | 504.9 | 111.2 |
| Table 2. Development class criteria (Heikkilä 2016) used in the evaluation of results. | ||
| Class | Number of plots | Criteria |
| Young stands | 10 | Mean diameter at breast height 8–16 cm or dominant height ≥ 7 m (conifers) or ≥ 9 m (deciduous trees); mean age 0.4–0.8 × recommended rotation period 1 |
| Advanced stands | 13 | Mean diameter at breast height > 16 cm and < recommended regeneration diameter, mean age > 0.8 × recommended rotation period 1 |
| Mature stands | 16 | Diameter ≥ 18–25 cm, age 50–100 years |
| 1 Recommended rotation period describes the time period between two final fellings and depends on the situation and objectives (e.g. Pukkala 2007). Recommended rotation period used in this study is described in Ajosenpää (2009). | ||
| Table 3. Details of the hybrid drone Avartek Boxer, Riegl VUX-1 UAV scanner and AP20 inertial measurement unit (IMU) system used for data collection. | |
| Flight speed | 4 m s–1 |
| Flying altitude | 50 m |
| Pulse repetition frequency | 380 hHz |
| Pulse density | 3700 pulses m–2 |
| Scanning angle | 120° |
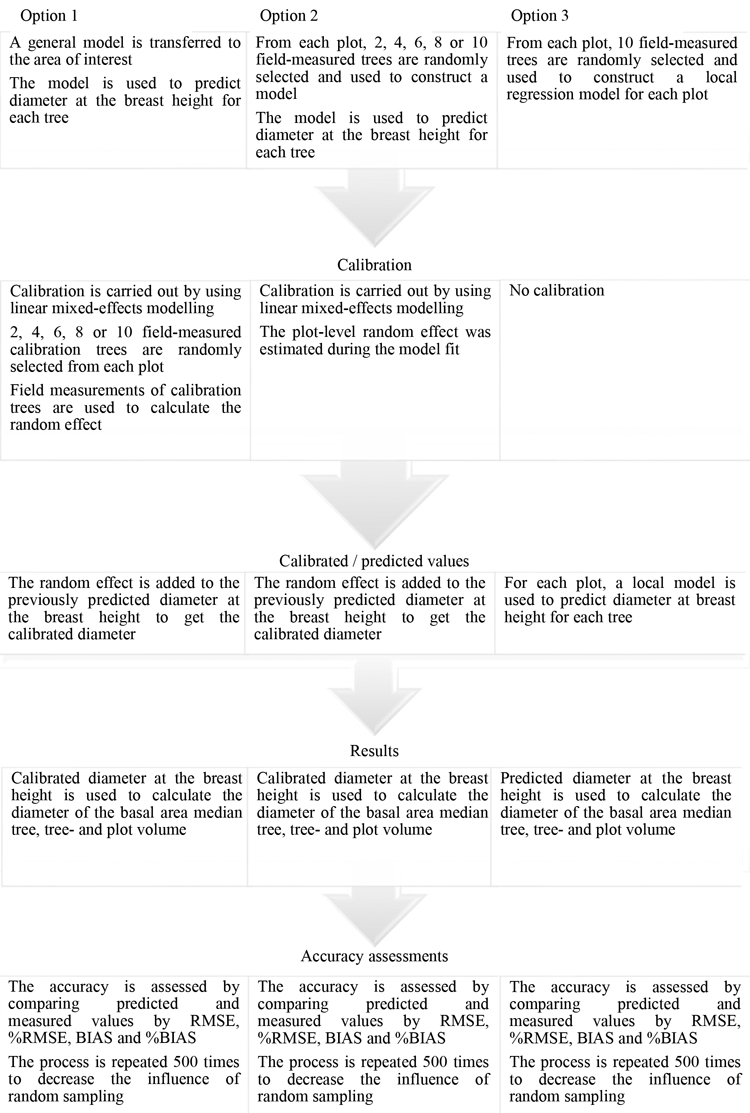
Fig 2. Flow chart describing the phases of the three different diameter at breast height (DBH) modelling and calibration options used in this study.
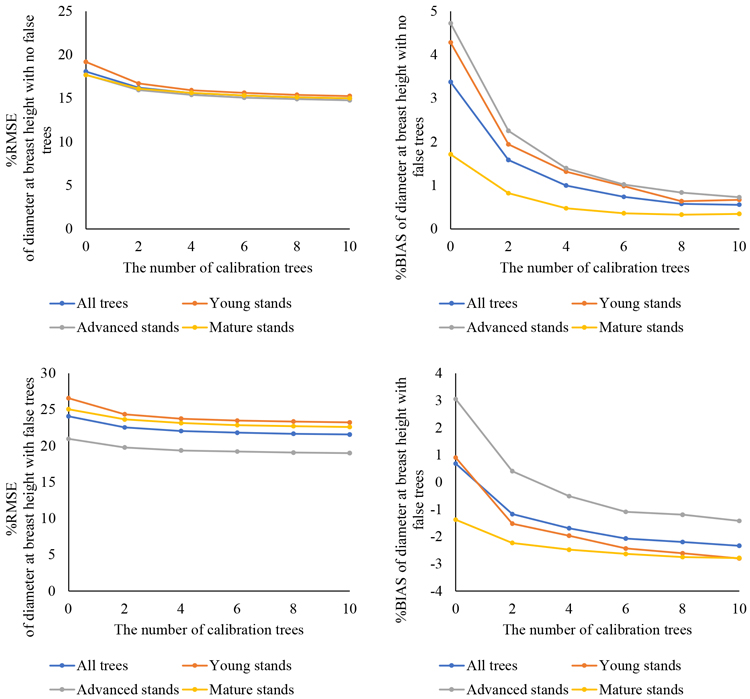
Fig 3. Prediction of diameter at breast height (DBH) with a general diameter/height model, calibration with field-measured trees and comparison with field measurements: relative root-mean-square error (%RMSE: left column) and relative BIAS (%BIAS: right column) with no false trees (upper row) and with false trees (lower row) are shown for the entire dataset and by development class.
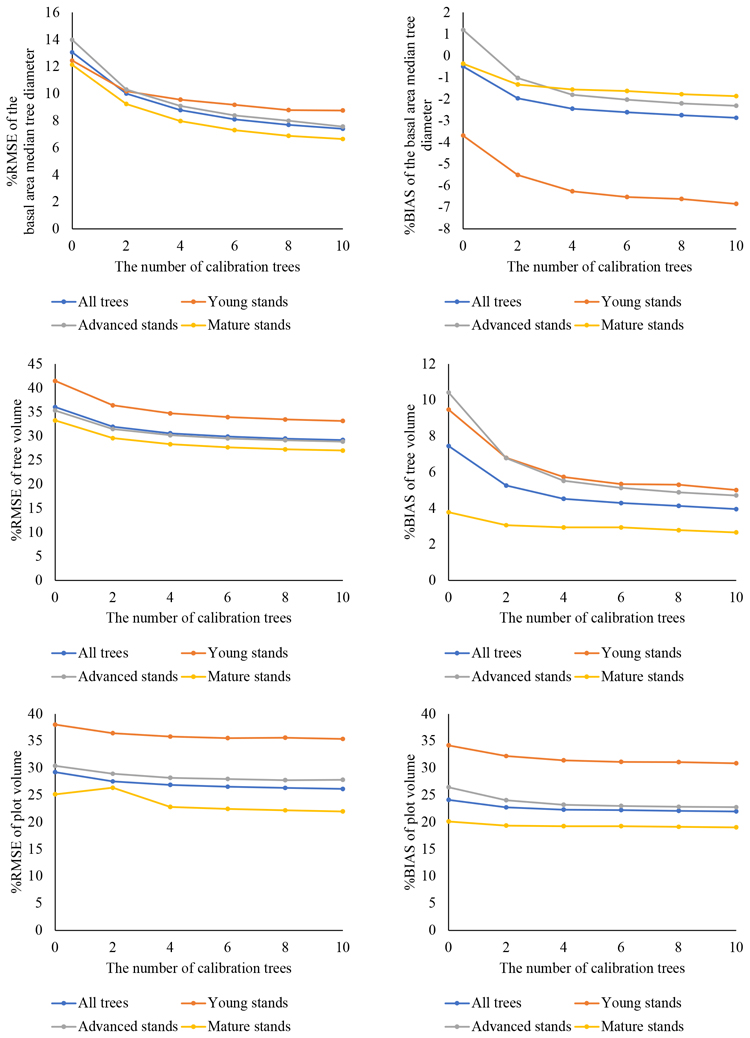
Fig 4. Prediction of diameter at breast height (DBH) with a general diameter/height model, calibration with field-measured trees, calculation of the diameter of the basal area median tree (DGM), tree and plot volumes and comparison with field measurements: relative root-mean-square error (%RMSE: left column) and relative BIAS (%BIAS: right column) with no false trees are shown for the entire dataset and by development class.
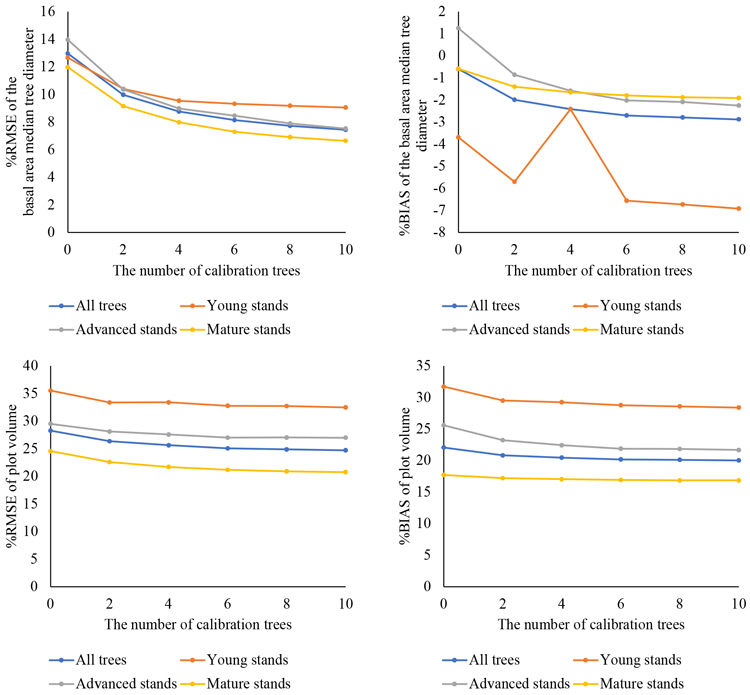
Fig. 5. Prediction of diameter at breast height (DBH) with a general diameter/height model, calibration with field-measured trees, calculation of the diameter of the basal area median tree (DGM), tree and plot volumes, and comparison with field measurements: relative root-mean-square error (%RMSE: left column) and relative BIAS (%BIAS: right column) with false trees are shown for the entire dataset and by development class.
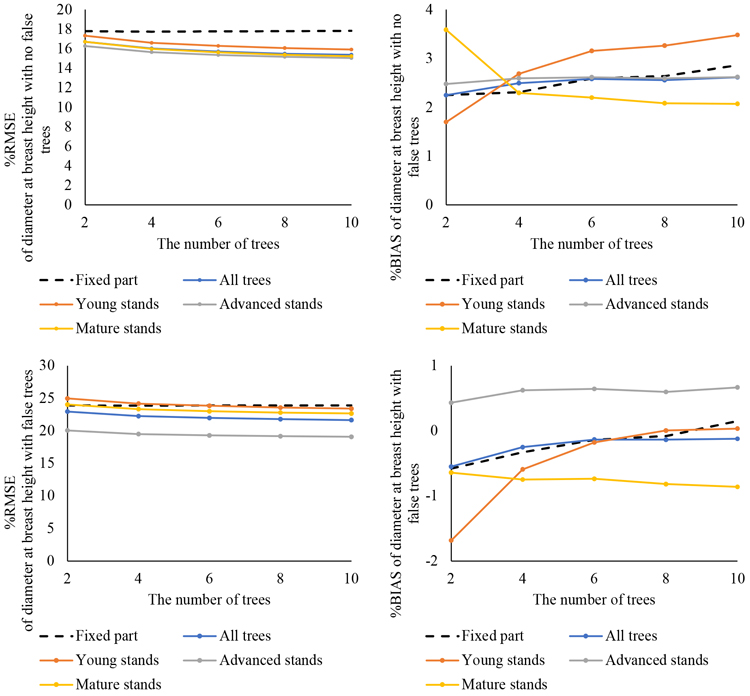
Fig 6. Prediction of diameter at breast height (DBH) with newly constructed diameter/height models, calibration and comparison with field measurements: relative root-mean-square error (%RMSE: left column) and relative BIAS (%BIAS: right column) with no false trees (upper row) and with false trees (lower row) are shown for the entire dataset and by development class. The fixed part of the model shows the performance for all trees without calibration.
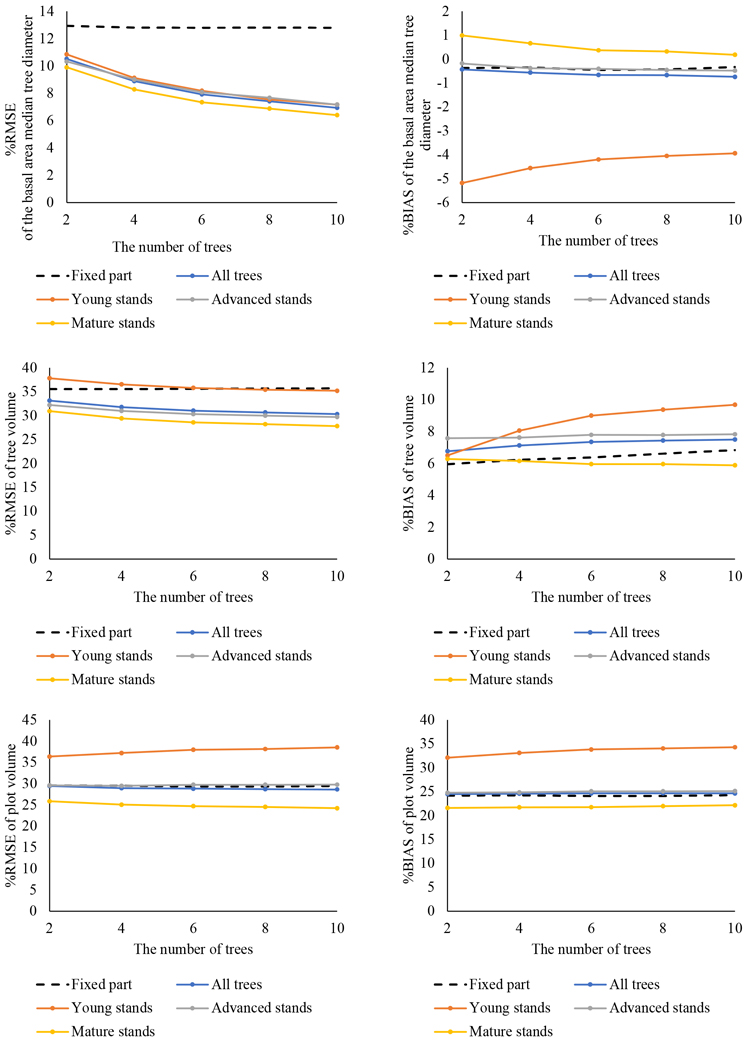
Fig. 7. Prediction of diameter at breast height (DBH) with newly constructed diameter/height models, calibration, calculation of the diameter of the basal area median tree (DGM), tree and plot volumes and comparison with field measurements: relative root-mean-square error (%RMSE: left column) and relative BIAS (%BIAS: right column) with no false trees are shown forthe entire dataset and by development class. The fixed part of the model shows the performance for all trees without calibration.
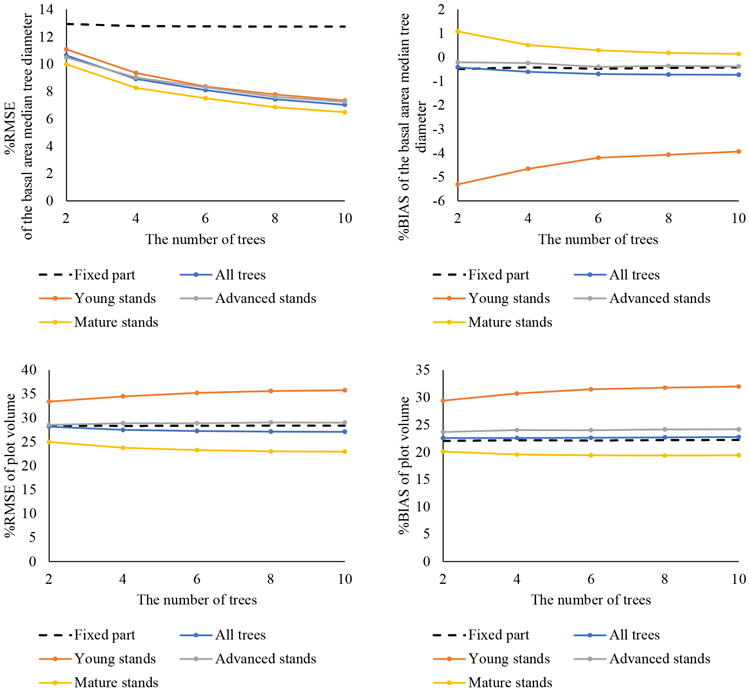
Fig. 8. Prediction of diameter at breast height (DBH) with newly constructed diameter/height models, calibration, calculation of the diameter of the basal area median tree (DGM), tree and plot volumes and comparison with field measurements: relative root-mean-square error (%RMSE: left column) and relative BIAS (%BIAS: right column) with false trees are shown for the entire dataset and by development class. The fixed part of the model shows the performance for all trees without calibration.
| Table 4. Prediction of diameter at breast height (DBH) with plot-level diameter/height models, calculation of the diameter of the basal area median tree (DGM), tree volume and plot volumes, and comparison of the results with field measurements: absolute (RMSE) and relative root-mean-square error (%RMSE) and absolute (BIAS) and relative BIAS (%BIAS) values with no false trees are shown for the entire dataset and by development class. | ||||
| RMSE | %RMSE | BIAS | %BIAS | |
| DBH | ||||
| All | 3.40 cm | 15.26 | 0.75 | 3.45 |
| Young stands | 2.64 cm | 16.28 | 0.73 | 4.48 |
| Advanced stands | 3.00 cm | 15.16 | 0.61 | 3.15 |
| Mature stands | 4.19 cm | 14.72 | 0.88 | 3.04 |
| DGM | ||||
| All | 1.51 cm | 6.37 | –0.14 | –0.57 |
| Young stands | 1.11 cm | 6.88 | –0.39 | –2.40 |
| Advanced stands | 1.44 cm | 7.00 | –0.09 | –0.42 |
| Mature stands | 1.71 cm | 5.54 | –0.02 | –0.05 |
| Tree-level volume | ||||
| All | 137.40 m3 | 30.20 | 38.25 | 8.63 |
| Young stands | 62.13 m3 | 34.99 | 21.32 | 11.52 |
| Advanced stands | 91.24 m3 | 30.03 | 23.53 | 8.21 |
| Mature stands | 221.94 m3 | 27.34 | 60.78 | 7.16 |
| Total volume | ||||
| All | 72.31 m3 ha–1 | 30.07 | 61.48 | 25.56 |
| Young stands | 64.69 m3 ha–1 | 40.46 | 56.81 | 35.53 |
| Advanced stands | 55.70 m3 ha–1 | 30.84 | 46.16 | 25.56 |
| Mature stands | 87.06 m3 ha–1 | 25.64 | 76.84 | 22.63 |
| Table 5. Prediction of diameter at breast height (DBH) with plot-level diameter/height models, calculation of the diameter of the basal area median tree (DGM), tree- and plot-volumes, and comparison of the results with field measurements: absolute (RMSE) and relative root-mean-square error (%RMSE) and absolute (BIAS) and relative BIAS (%BIAS) values with false trees are shown for the entire dataset and by development class. | ||||
| RMSE | %RMSE | BIAS | %BIAS | |
| DBH | ||||
| All | 4.74 cm | 22.11 | 0.05 | 0.33 |
| Young stands | 3.60 cm | 23.34 | 0.22 | 1.29 |
| Advanced stands | 3.68 cm | 19.52 | 0.19 | 0.91 |
| Mature stands | 6.31 cm | 23.44 | –0.18 | –0.74 |
| DGM | ||||
| All | 1.71 cm | 7.22 | –0.15 | –0.64 |
| Young stands | 1.12 cm | 6.95 | –0.39 | –2.38 |
| Advanced stands | 1.43 cm | 6.92 | –0.04 | –0.20 |
| Mature stands | 2.04 cm | 6.61 | –0.10 | –0.31 |
| Total volume | ||||
| All | 68.57 m3 ha–1 | 28.51 | 57.02 | 23.71 |
| Young stands | 60.47 m3 ha–1 | 37.82 | 53.22 | 33.29 |
| Advanced stands | 54.60 m3 ha–1 | 30.23 | 44.59 | 24.69 |
| Mature stands | 81.97 m3 ha–1 | 24.14 | 69.51 | 20.47 |