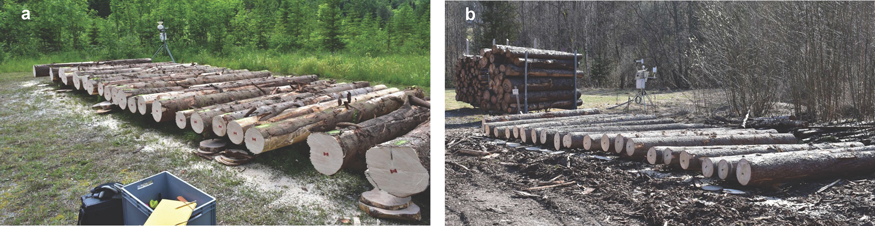
Fig. 1. Norway spruce logs at the experimental sites (a) Jagerbauerngraben in summer 2020 and (b) Krampen in spring 2021 prior to investigation of blue-stain development. In the background the weather stations are visible.
| Table 1. Descriptive statistics including mean, standard deviation (sd), minimum (min), maximum (max) and piece count (n) of the length, mid-diameter and volume over bark (ob) of the Norway spruce logs that were investigated regarding blue-stain development for the trial campaigns in summer 2020 and spring 2021 at both sites, Jagerbauerngraben (JBG) and Krampen (KRA). | ||||||||||||
| summer.JBG | summer.KRA | spring.JBG | spring.KRA | |||||||||
| length [cm] | mid-diameter [cmob] | volume [m3ob] | length [cm] | mid-diameter [cmob] | volume [m3ob] | length [cm] | mid-diameter [cmob] | volume [m3ob] | length [cm] | mid-diameter [cmob] | volume [m3ob] | |
| mean | 406.50 | 31.54 | 0.32 | 204.10 | 29.21 | 0.14 | 405.75 | 34.14 | 0.38 | 404.17 | 33.92 | 0.37 |
| sd | 2.65 | 4.34 | 0.09 | 1.29 | 2.08 | 0.02 | 1.57 | 4.64 | 0.10 | 2.53 | 4.13 | 0.09 |
| min | 401.00 | 24.93 | 0.20 | 202.00 | 26.40 | 0.11 | 402.00 | 26.55 | 0.22 | 399.00 | 26.20 | 0.22 |
| max | 410.00 | 38.40 | 0.47 | 207.00 | 33.75 | 0.18 | 408.00 | 42.68 | 0.58 | 407.00 | 42.15 | 0.57 |
| n | 24 | 48 | 24 | 24 | ||||||||
| Table 2. Time scheme of sampling for both trial campaigns 2020 and 2021. T0 marks the date when the Norway spruce logs were stored at the trial sites. T1–T8 represent the sampling dates, on which log slices were cut to investigate blue-stain development. | |||||||||
| sample date ID | T0 | T1 | T2 | T3 | T4 | T5 | T6 | T7 | T8 |
| storage time 2020 (days) | 0 | 7 | 14 | 22 | 29 | 37 | 43 | 50 | 56 |
| sample date 2020 | Jul. 14th | Jul. 21st | Jul. 28th | Aug. 05th | Aug. 12th | Aug. 20th | Aug. 26th | Sept. 2nd | Sept. 8th |
| storage time 2021 (days) | 0 | 38 | 46 | 53 | 60 | 67 | 74 | 81 | 88 |
| sample date 2021 | Apr. 3rd | May. 11th | May. 19th | May. 26th | Jun. 2nd | Jun. 9th | Jun. 16th | Jun. 23rd | Jun. 30th |
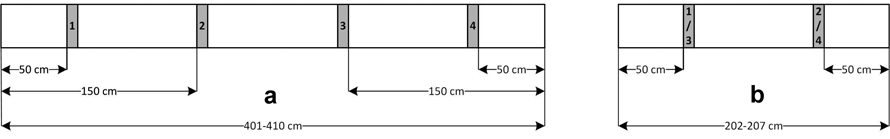
Fig. 2. Cutting scheme of the log slices that were used for the quantification of blue-stain growth in Norway spruce logs for (a) Jagerbauerngraben and Krampen 2021 and (b) Krampen 2020.
| Table 3. Descriptive statistics including mean, minimum (min), maximum (max) of daily mean temperature, average relative humidity and daily precipitation for the trial sites Jagerbauerngraben (JBG) and Krampen (KRA) for the trial periods Jun. 26th (KRA) and Jul. 7th (JBG) 2020 to Sep. 8th, 2020 and Mar. 4th (JBG) and Mar. 19th (KRA) 2021 to June 30th, 2021, during which the development of blue-stain on Norway spruce logs was investigated. For precipitation the sum is also presented. | ||||||||||||
| 2020 | 2021 | |||||||||||
| Jagerbauerngraben (JBG) | Krampen (KRA) | Jagerbauerngraben (JBG) | Krampen (KRA) | |||||||||
| daily mean temperature [°C] | average relative humidity [%] | daily precipitation [mm] | daily mean temperature [°C] | average relative humidity [%] | daily precipitation [mm] | daily mean temperature [°C] | average relative humidity [%] | daily precipitation [mm] | daily mean temperature [°C] | average relative humidity [%] | daily precipitation [mm] | |
| mean | 14.86 | 87.68 | 6.35 | 14.95 | 87.26 | 4.24 | 6.57 | 79.82 | 1.80 | 7.95 | 77.89 | 2.08 |
| min | 8.63 | 70.36 | 0.00 | 9.09 | 67.66 | 0.00 | –5.64 | 50.31 | 0.00 | –4.39 | 59.39 | 0.00 |
| max | 19.78 | 100.00 | 40.20 | 20.29 | 97.34 | 50.80 | 23.11 | 99.43 | 18.40 | 20.92 | 94.26 | 19.10 |
| sum | 361.80 | 241.40 | 213.80 | 216.20 | ||||||||
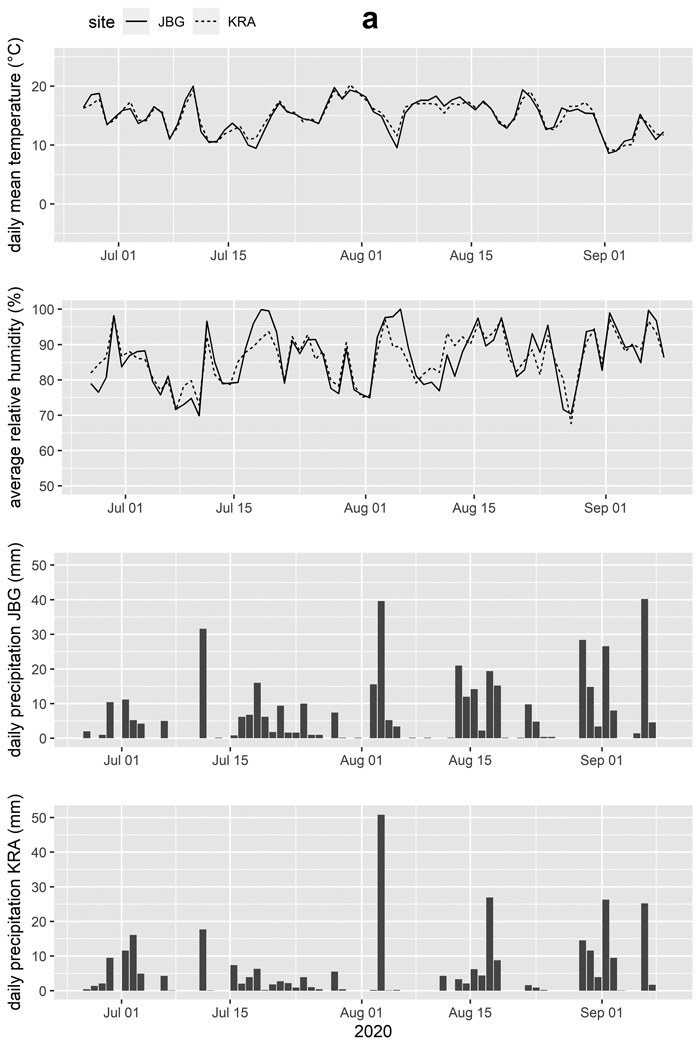
Fig. 3a. Daily mean temperature, average relative humidity and daily precipitation for the trial sites Jagerbauerngraben (JBG) and Krampen (KRA) for the trial periods (a) Jun. 26th, 2020 to Sep. 8th, 2020, during which blue-stain development in Norway spruce logs was investigated.
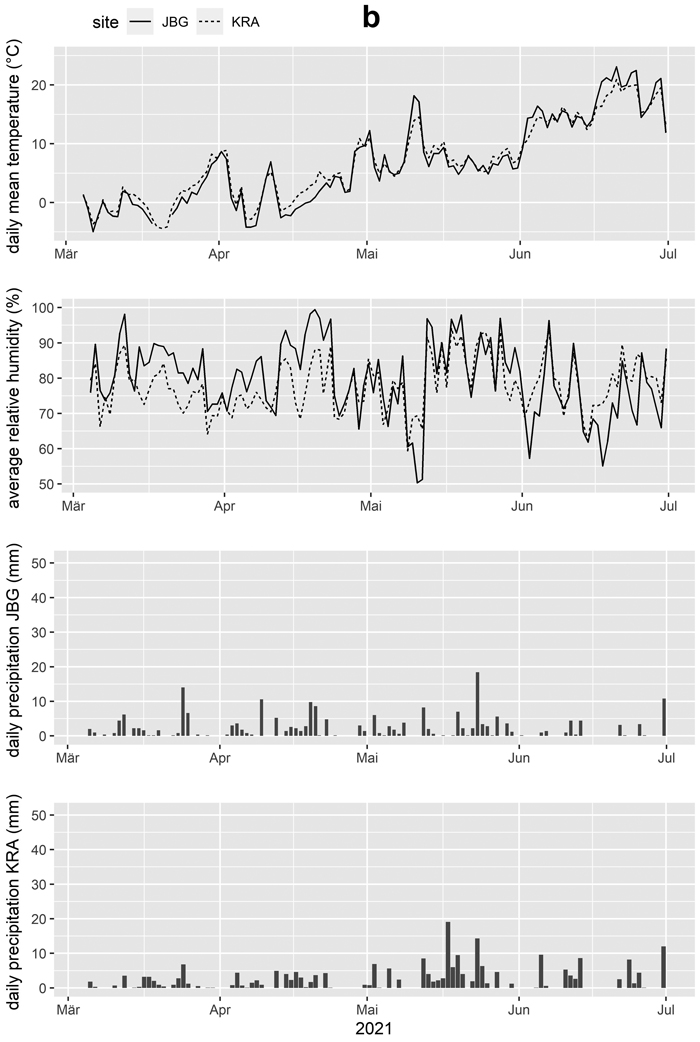
Fig. 3b. Daily mean temperature, average relative humidity and daily precipitation for the trial sites Jagerbauerngraben (JBG) and Krampen (KRA) for the trial periods Mar. 4th, 2021 to Jun. 30th, 2021, during which blue-stain development in Norway spruce logs was investigated.
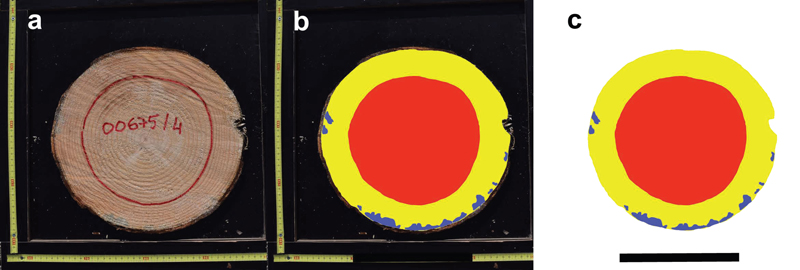
Fig. 4. (a) Norway spruce log disk 00675-4 cut at the experimental site Jagerbauerngraben at Aug. 12th, 2020 after 29 days of log storage. (b) On the log slice digitally colored areas “sapwood without discoloration” (yellow), “blue-stained sapwood” (blue) and “heartwood” (red) and (c) PNG file prepared for analysis with scaling bar. In this example, 5.56% of the sapwood area is discolored by sap-stain fungi.
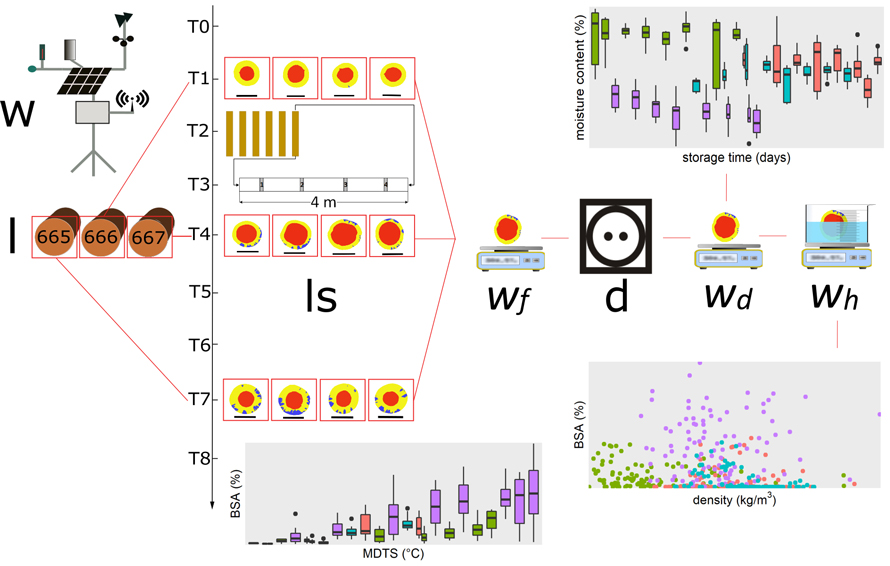
Fig. 5. Schematic diagram of the experiment (w = weather station, l = Norway spruce logs, ls = log slices with digitally colorized heartwood, sapwood and blue-stained sapwood as well as the scale bar, wf = fresh weight, d = dry cabinet, wd = dry weight, wh = weight of displaced water).
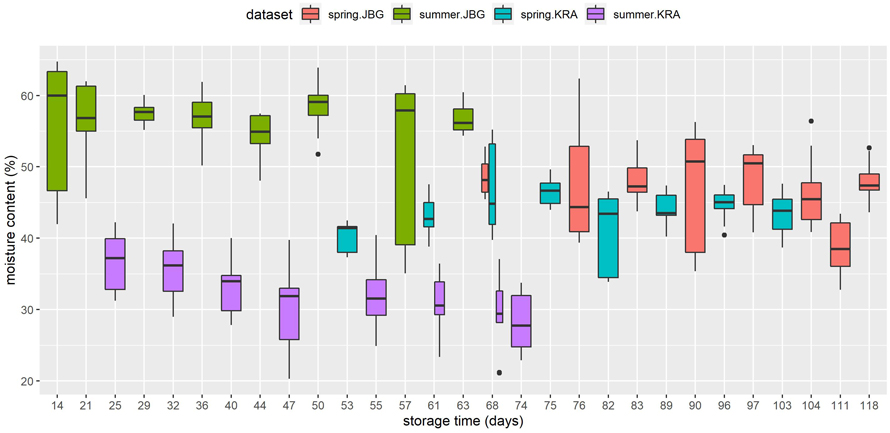
Fig. 6. Moisture content (%) of the Norway spruce log slices (sapwood and heartwood), which were used for the quantification of blue-stain development, in relation to storage time (days) for each dataset.
| Table 4. Descriptive statistics of the density of the Norway spruce log slices, that were used to quantify blue-stain development, including the results of Tukey’s HSD test, mean, standard deviation (sd), minimum (min), maximum (max), the 5th,50th and 95th percentiles for the four datasets from both trial sites JBG and KRA and both trial campaigns in 2020 and 2021. The significance letters “a”, “b” and “c” in the Tukey’s HSD row indicate significant differences between the datasets with a confidence level of 0.95. | |||||
| density [kg m–3] | |||||
| summer.JBG | summer.KRA | spring.JBG | spring.KRA | overall | |
| Tukey’s HSD | a | b | b | c | |
| mean | 375 | 438 | 444 | 464 | 431 |
| sd | 46 | 40 | 36 | 31 | 51 |
| min | 319 | 368 | 380 | 400 | 319 |
| 5% | 327 | 378 | 395 | 414 | 340 |
| 50% | 364 | 432 | 440 | 463 | 431 |
| 95% | 454 | 505 | 507 | 517 | 509 |
| max | 560 | 594 | 570 | 531 | 594 |
| n | 96 | 96 | 96 | 96 | 384 |
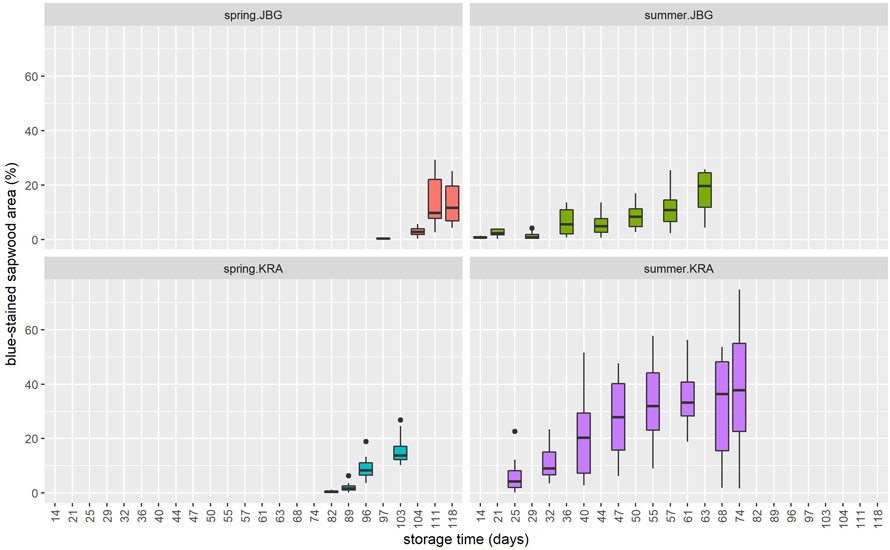
Fig. 7. Percentage of blue-stained sapwood area on Norway spruce log slices depending on the storage time (days), separated by site (KRA = Krampen, JGB = Jagerbauerngraben) and season (spring or summer). For clarity, the data is not displayed in this graph when the value for the relative blue-stained sapwood area is 0.
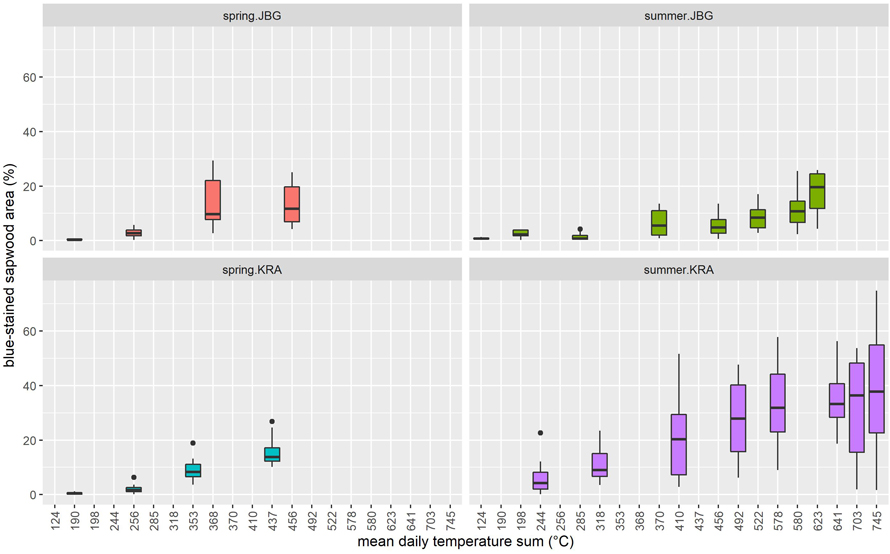
Fig. 8. Percentage of blue-stained sapwood area on Norway spruce log slices depending on the mean daily temperature sum (°C) above 5 °C, separated by site (KRA = Krampen, JGB = Jagerbauerngraben) and season (spring or summer). For clarity, the data is not displayed in this graph when the value for the relative blue-stained sapwood area is 0.
| Table 5. Summary of the results of the ANCOVAs, which tested the effect of the mean daily temperature sum to which the Norway spruce logs were exposed, on the percentage of sapwood that was discolored by sap-staining fungi, taking site effects, season effects and interactions into account (LI, ME, MDTS = mean daily temperature sum, R2 = coefficient of determination, σ2 = variance of the residuals, τ00 = variance of random effects, RMSE = root mean square error, AIC = Akaike’s information criterion). | ||||||
| Predictors | Linear Interactions (LI) | Mixed Effects (ME) | ||||
| Estimates | CI | p | Estimates | CI | p | |
| MDTS | 0.04 | 0.04 – 0.05 | <0.001 | 0.03 | 0.03 – 0.04 | <0.001 |
| site [JBG] | –5.33 | –7.39 – –3.28 | <0.001 | |||
| site [KRA] | –5.36 | –7.40 – –3.32 | <0.001 | |||
| season [summer] | –5.25 | –7.88 – –2.63 | <0.001 | |||
| site [KRA] × season [summer] | 13.72 | 10.25 – 17.19 | <0.001 | |||
| Random effects: | ||||||
| σ2 | 18.88 | |||||
| τ00 | 0.00 site | |||||
| 31.61 season | ||||||
| Observations | 384 | 288 | ||||
| R2 / R2 adjusted | 0.756 / 0.753 | |||||
| Marginal R2 / Conditional R2 | 0.643 / NA | |||||
| RMSE | 8.40 | 4.32 | ||||
| AIC | 2736.701 | 1692.266 | ||||
| Table 6. Summary of the results of the non-linear least square regression analysis, which tested the effect of the mean daily temperature sum to which the Norway spruce logs were exposed, on the percentage of sapwood that was discolored by sap-staining fungi (R2 = coefficient of determination, RMSE = root mean square error, AIC = Akaike’s Information Criterion). | |||||
| Non-Linear (NL) | |||||
| Term | Estimates | Std.error | t-statistics | p | CI95 |
| a | 43.87 | 6.85 | 6.40 | <0.001 | 30.37, 57.36 |
| b | –662.17 | 71.81 | –9.22 | <0.001 | –803.63, –520.70 |
| Observations | 288 | ||||
| R2 | 0.56 | ||||
| RMSE | 4.48 | ||||
| AIC | 1687.284 | ||||
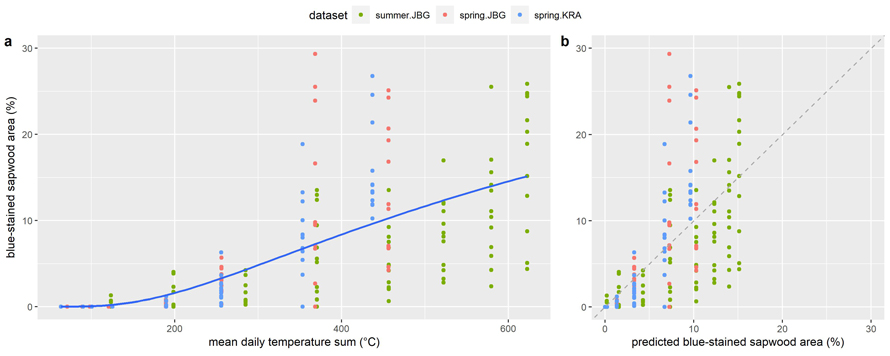
Fig. 9. Percentage of blue-stained sapwood area on Norway spruce log slices in relation to (a) mean daily temperature sum (°C) above 5 °C including the regression line of the NL model (Table 6) that was obtained from the datasets summer.JBG, spring.JBG and spring.KRA and (b) the percentage of blue-stained sapwood, that was predicted by the NL model. The dashed line represents the line of perfect fit (y = x). View larger in new window/tab.