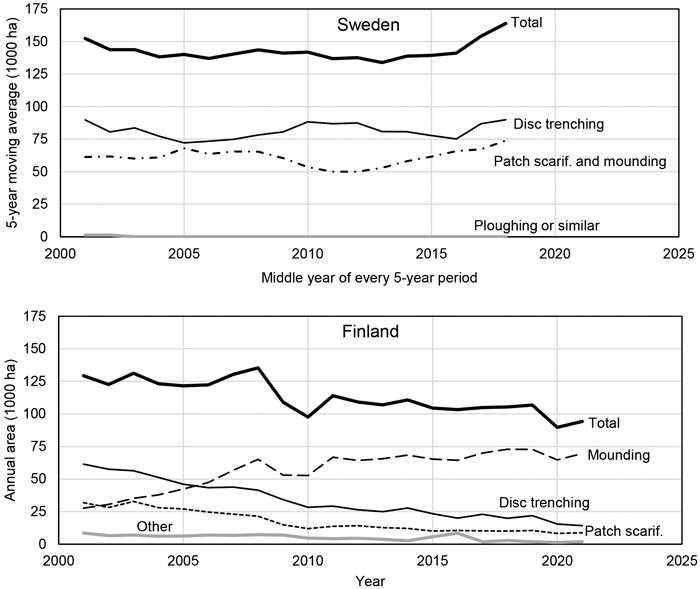
Fig. 1. Annual area subjected to various forms of mechanical site preparation in Sweden (top) and Finland (bottom). The data for Sweden are 5-year moving averages plotted against the middle year of each 5-year period, hence, the first and last data points represent 1999–2003 and 2016–2020, respectively. For Finland, annual areas for the period 2001 to 2021 are presented. The data were provided by the Swedish National Forest Inventory (2022) and Luke Statistics database (http://statdb.luke.fi/PXWeb/pxweb/en/LUKE/LUKE__04%20Metsa__06%20Metsavarat/, accessed on 13 December 2022). “Patch scarif.” refers to patch scarification.
| Table 1. Articles and number of articles reporting impacts of mechanical site preparation (MSP) on various environmental variables, based on studies performed in Sweden and Finland, sorted by MSP practice. The MSP practice “Other” refers to MSP performed experimentally by hand or excavator, or by the MSP practice HuMinMix (see section 9). | ||||||
| Environmental variable | MSP practice | |||||
| Patch scarification | Mounding | Inverting | Disc trenching | Ploughing | Other | |
| Nitrogen1 | 2 | 4 | 1 | 10 | 5 | 7 |
| (Nordborg et al. 2006; Egnell et al. 2015) | (Johansson 1994; Smolander et al. 2000; Smolander and Heiskanen 2007; Nieminen et al. 2012) | (Smolander and Heiskanen 2007) | (Johansson 1994; Lundmark-Thelin and Johansson 1997; Mannerkoski et al. 2005; Palviainen et al. 2007; Piirainen et al. 2007; Johansson et al. 2013; Närhi et al. 2013; Ring et al. 2013; Piirainen et al. 2015; Rappe George et al. 2017) | (Johansson 1994; Kubin 1995, 1998; Tanskanen and Ilvesniemi 2004; Sutinen et al. 2019) | (Ring 1996; Örlander et al. 1996; Nohrstedt 2000; Nordborg et al. 2006; Egnell et al. 2015; Mjöfors et al. 2015; Ring et al. 2018) | |
| Carbon and/or biomass1 | 2 | 4 | 1 | 10 | 6 | 4 |
| (Nordborg et al. 2006; Egnell et al. 2015) | (Johansson 1994; Smolander et al. 2000; Smolander and Heiskanen 2007; Mjöfors et al. 2017) | (Smolander and Heiskanen 2007) | (Johansson 1994; Lundmark-Thelin and Johansson 1997; Mannerkoski et al. 2005; Palviainen et al. 2007; Piirainen et al. 2007; Johansson et al. 2013; Närhi et al. 2013; Ring et al. 2013; Piirainen et al. 2015; Mjöfors et al. 2017) | (Johansson 1994; Tanskanen and Ilvesniemi 2004; Tanskanen et al. 2004; Tanskanen and Ilvesniemi 2007; Mjöfors et al. 2017; Sutinen et al. 2019) | (Örlander et al. 1996; Nordborg et al. 2006; Egnell et al. 2015; Mjöfors et al. 2015) | |
| GHG emission | 2 | 2 | 0 | 3 | 0 | 2 |
| (Strömgren and Mjöfors 2012; Strömgren et al. 2017) | (Strömgren et al. 2012, 2016) | (Strömgren and Mjöfors 2012; Strömgren et al. 2016, 2017) | (Pumpanen et al. 2004; Mjöfors et al. 2015) | |||
| Other chemical variables2 | 0 | 4 | 1 | 9 | 9 | 1 |
| (Johansson 1994; Smolander et al. 2000; Smolander and Heiskanen 2007; Nieminen et al. 2012) | (Smolander and Heiskanen 2007) | (Johansson 1994; Lundmark-Thelin and Johansson 1997; Mannerkoski et al. 2005; Palviainen et al. 2007; Piirainen et al. 2007, 2009; Johansson et al. 2013; Närhi et al. 2013; Ring et al. 2013) | (Johansson 1994; Kubin 1995; Tanskanen and Ilvesniemi 2004; Tanskanen et al. 2004; Sutinen et al. 2006, 2010, 2019; Lindroos et al. 2016; Lindroos and Ilvesniemi 2023) | (Örlander et al. 1996) | ||
| Ground vegetation3 | 2 | 2 | 0 | 5 | 3 | 2 |
| (Norberg et al. 1997; Tonteri et al. 2022) | (Roturier and Bergsten 2006; Tonteri et al. 2022) | (Eriksson and Raunistola 1990; Bergstedt et al. 2008; Roturier et al. 2011; Vanha-Majamaa et al. 2017; Tonteri et al. 2022) | (Eriksson and Raunistola 1990; Bergstedt et al. 2008; Tonteri et al. 2022) | (Roturier and Bergsten 2006; Roturier et al. 2011) | ||
| 1 Including decomposition, mineralisation (nitrification for N), water and soil concentrations, leaching and soil and vegetation stores. 2 Including one or several chemical variables other than N and C, for example electrical conductivity, pH, cations and anions. 3 Including vegetation coverage and species composition. | ||||||
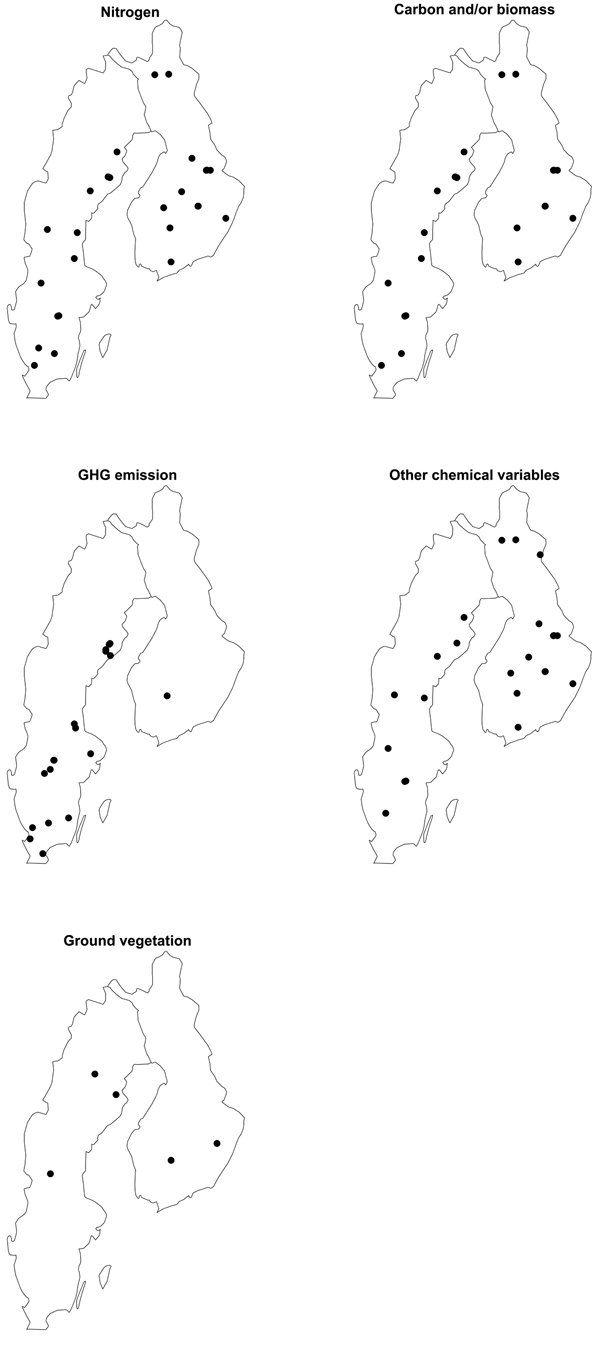
Fig. 2. Location of study sites in Sweden and Finland where environmental impact of MSP on nitrogen (n = 27), carbon and/or biomass (n = 21), greenhouse gas (GHG) emissions (n = 18), other chemical variables (n = 23) and ground vegetation species and/or cover (n = 5) have been investigated (NB: there was insufficient site information for one site where N, C and /or biomass and other chemical variables were studied). Sites surveyed in synoptic studies are not shown on the maps. The maps were produced by Per Westerfelt.
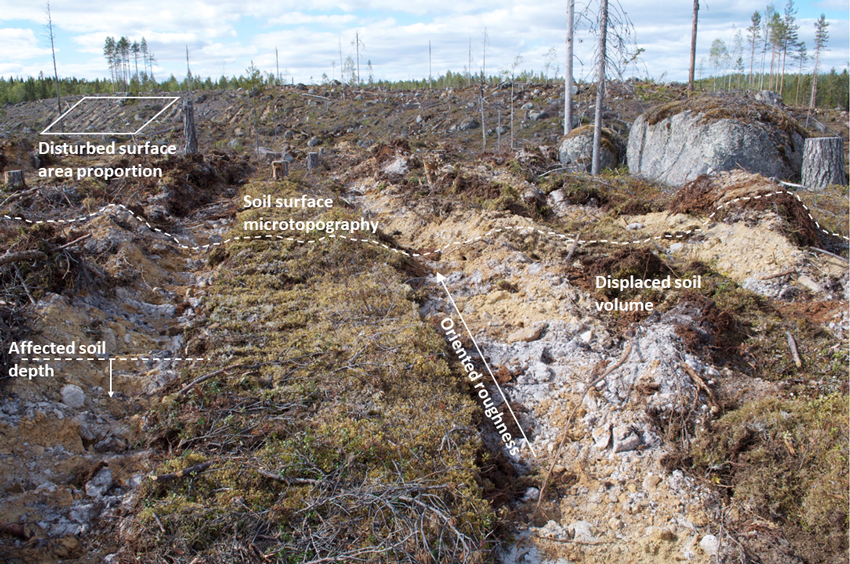
Fig. 3. A clearcut site subjected to disc trenching on which various metrics of soil disturbance are illustrated schematically. Oriented roughness refers to a systematic variation in topography caused by, for example, tillage. Photo E. Ring.
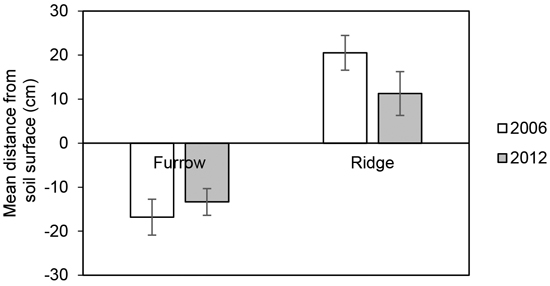
Fig. 4. Mean distance from the undisturbed soil surface to the bottom of the furrow and top of the ridge, respectively, about two months after disc trenching in 2006 (data from Ring et al. 2013) and in 2012 six and a half years later. The measurements were carried out at the Hagfors field site in Sweden (n2006 = 27, n2012 = 54). The error bars show ±1 standard deviation.