| Table 1. Description of the research sites where the effects of nitrogen fertilization on ground vegetation were studied. The research sites were located in Eastern-Finland. The mean annual air temperature and the annual precipitation are the 30-year average from 1990–2020 (Finnish Meteorological Institute 2023). Stand characteristics were calculated as averages of 27 plots (200 m2). | ||||
| Research site | Liperi | Ilomantsi | Juuka | Savonranta |
| Latitude | 62,55846 N | 62,85543 N | 63,066199 N | 62,139028 N |
| Longitude | 29,06265 E | 30,67705 E | 28,874640 E | 29,149086 E |
| Altitude (m a.s.l.) | 160 | 180 | 170–200 | 120–140 |
| Dominant tree species | Pinus sylvestris | Pinus sylvestris | Picea abies | Picea abies |
| Pinus sylvestris volume (%) | 78 | 86 | 0 | 11.6 |
| Picea abies volume (%) | 19.3 | 12.5 | 86.6 | 86.4 |
| Betula spp. volume (%) | 2.7 | 1.5 | 4.6 | 2.0 |
| Mean annual air temperature (°C) | 3.5 | 3.0 | 2.8 | 3.4 |
| Effective temperature sum (d.d.) | 1200–1300 | 1100–1200 | 1100–1200 | 1200–1300 |
| Annual precipitation (mm) | 640 | 644 | 661 | 670 |
| Date of N application | 27.06.2018 | 20.07.2018 | 25.–27.07.2019 | 10.08.2019 |
| Means of application | Forwarder | Forwarder | Helicopter | Helicopter |
| Stand density (stems ha–1) | 513 | 687 | 619 | 455 |
| Mean diameter at breast height (cm) | 23 | 18 | 21 | 21 |
| Initial volume (m3 ha–1) | 167 | 170 | 187 | 159 |
| Range of the N fertilizer dose (kg N ha–1) (> 0 in plots*) | 110–288 | 109–369 | 48–441 | 50–426 |
| *) In Ilomantsi in one plot and in Savonranta in two plots planned to be fertilized the funnel-trap-observed amount of fertilizer was zero due to problems in fertilizing and they were excluded from range values. | ||||
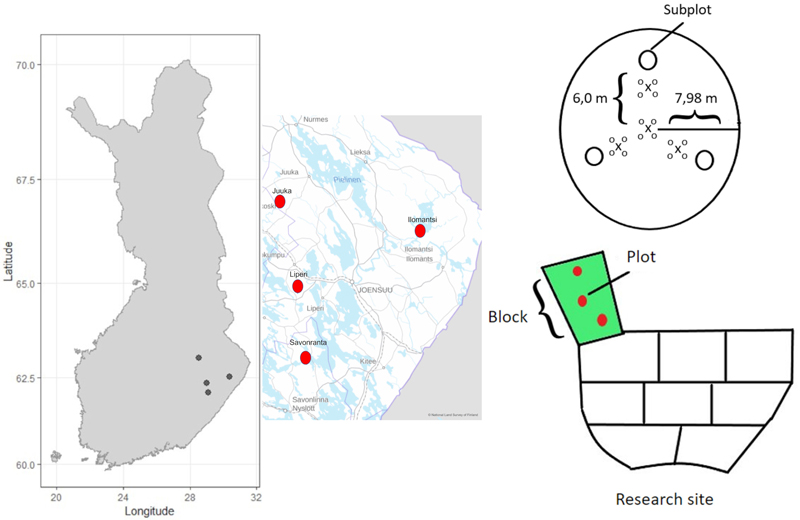
Fig. 1. The location of the four research sites in Eastern Finland, a schematic presentation of the block-design including three replicates of the fertilization treatments (150 kg N ha–1 and 200 kg N ha–1) and unfertilized control blocks. Each block contained three circular plots (200 m2) from where the tree characteristics were measured. Each plot further contained three subplots (0.5 m2) for measuring the cover and species composition of the ground vegetation. Every plot (200 m2) also contained four mineral soil sample points and sixteen mor humus layer sample points.
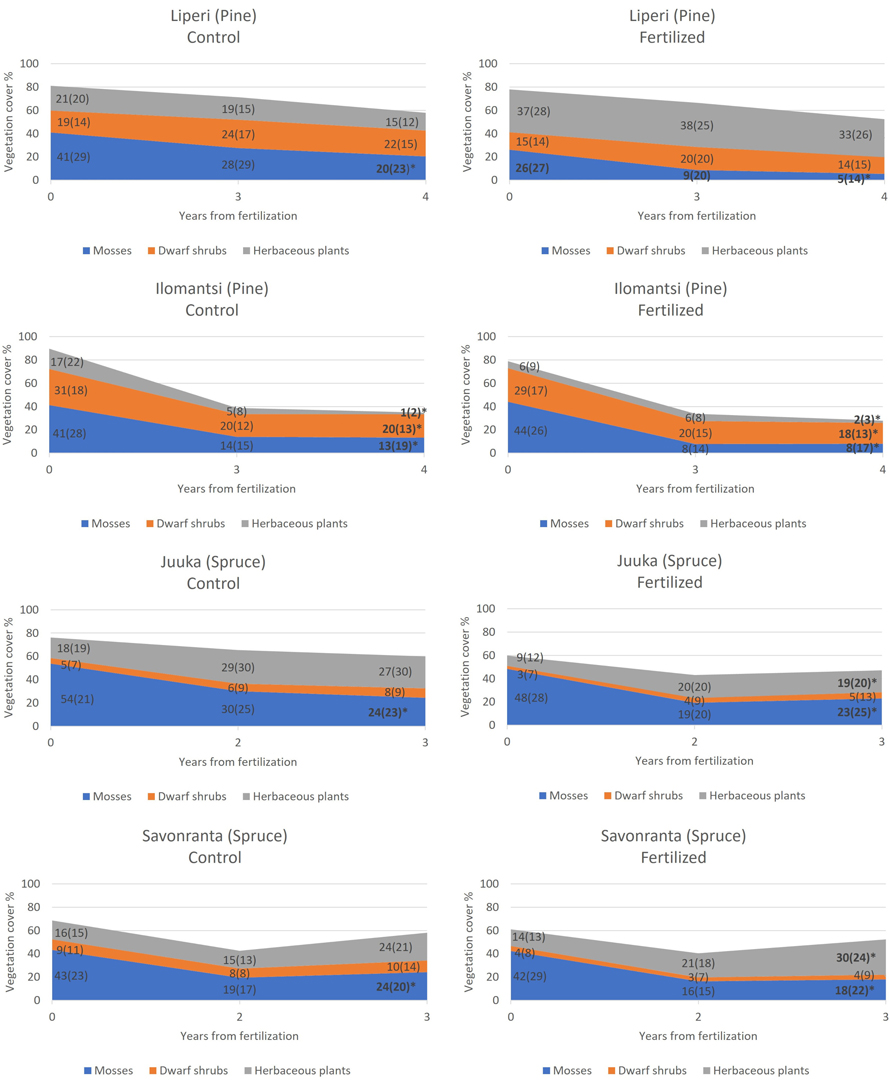
Fig. 2. The development of mean cover of mosses and lichens, dwarf shrubs and herbaceous plants in unfertilized control plots (left) and in fertilized plots (right) during the study period. Standard deviations are presented in parenthesis. The plots were fertilized in 2018 (Liperi, Ilomantsi) and 2019 (Juuka, Savonranta). An asterisk in the year 2022 indicates statistically significant change in the mean cover from 2018 to 2022 (Liperi, Ilomantsi) and from 2019 to 2022 (Juuka, Savonranta).
| Table 2. The change in the ground vegetation and coarse woody debris cover expressed as slopes (β1, Eq. 1) from linear regression analysis. The slope describes the arcsine-square root transformed cover change per amount of funnel-trap-observed N (Mg ha–1). If the slope is negative the cover is reduced by the fertilization and if the slope is positive the cover increases. Statistically significant slope values (p < 0.05) are shown as bold text. | ||||||||||||
| Vegetation cover | Liperi (Pine) | Ilomantsi (Pine) | Juuka (Spruce) | Savonranta (Spruce) | ||||||||
| 2018–2021 | 2018–2022 | 2021–2022 | 2018–2021 | 2018–2022 | 2021–2022 | 2019–2021 | 2019–2022 | 2021–2022 | 2019–2021 | 2019–2022 | 2021–2022 | |
| Tree seedlings | 0.01 | –0.05 | –0.06 | 0.17 | 0.52 | 0.24 | 0.00 | 0.03 | 0.03 | 0.05 | 0.13 | 0.08 |
| Herbaceous plants | 0.11 | 0.04 | –0.08 | 0.56 | 0.36 | –0.08 | 0.12 | 0.21 | 0.09 | 0.39 | 0.50 | 0.11 |
| Grasses | –0.42 | –0.50 | –0.08 | 0.35 | 0.19 | –0.08 | 0.34 | 0.40 | 0.07 | 0.17 | 0.23 | –0.06 |
| Herbs | –0.08 | 0.18 | 0.26 | 0.32 | 0.28 | 0.02 | –0.18 | –0.07 | 0.08 | 0.06 | 0.10 | 0.07 |
| Pteridophytes | 0.48 | 0.27 | –0.21 | 0.03 | –0.02 | –0.02 | –0.08 | –0.08 | 0.00 | 0.22 | 0.38 | 0.16 |
| Dwarf shrubs | –0.25 | –0.39 | –0.15 | 0.00 | 0.01 | 0.18 | –0.04 | –0.02 | 0.02 | –0.05 | –0.18 | –0.12 |
| Vaccinium myrtillus | –0.18 | –0.33 | –0.15 | 0.09 | 0.32 | 0.36 | –0.01 | –0.03 | –0.01 | –0.04 | –0.13 | –0.09 |
| Vaccinium vitis-idaea | –0.15 | –0.11 | 0.04 | 0.02 | –0.06 | –0.09 | –0.03 | –0.02 | 0.01 | 0.01 | 0.00 | –0.01 |
| Mosses and lichens | –0.39 | –0.23 | 0.13 | –0.55 | –0.57 | 0.11 | –0.60 | –0.29 | 0.30 | –0.08 | –0.29 | –0.21 |
| CWD | 0.52 | 0.13 | –0.39 | –0.28 | 0.38 | 0.62 | 0.23 | 0.41 | 0.18 | –0.04 | 0.17 | 0.21 |
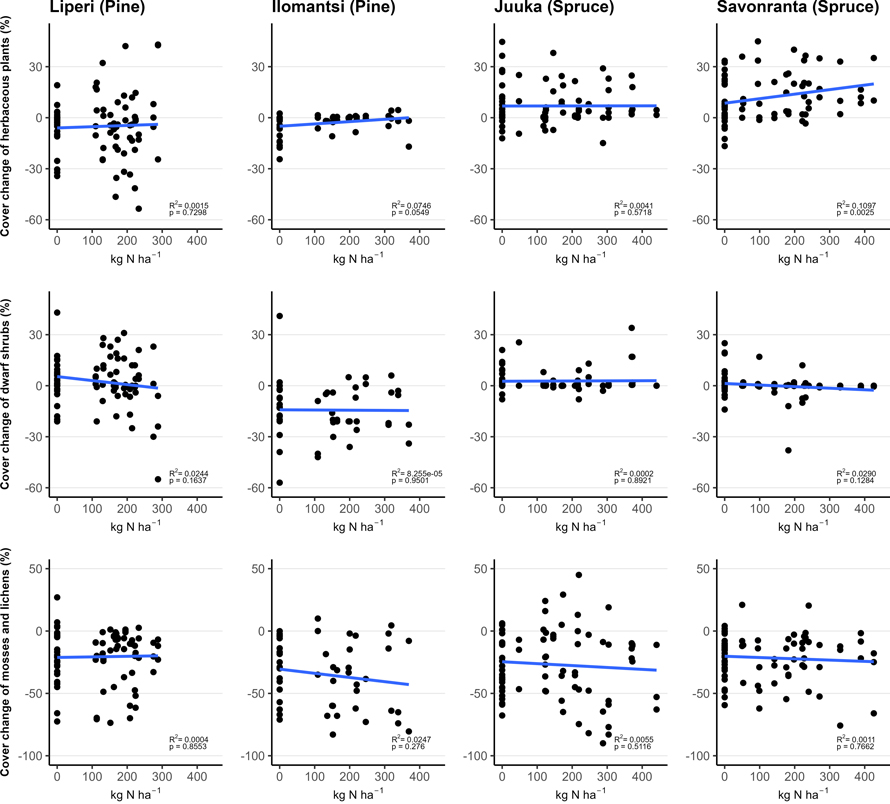
Fig. 3. The relationship between funnel-trap-observed N amount (in plots with area of 200 m2) and vegetation cover change (%) of the mosses and lichens, dwarf shrubs and herbaceous plants in vegetation sub-plots between 2018 (Liperi, Ilomantsi) or 2019 (Juuka, Savonranta) and 2022. The points indicate the measured change in cover with corresponding funnel-trap-observed N amount.
| Table 3. Concentration of nitrogen (N) (% of dry mass) and carbon to nitrogen (C:N) ratio in the mor humus layer three to four years after fertilization in unfertilized control plots and fertilized plots. | ||||
| Research site | N | C:N | ||
| Control | Fertilized | Control | Fertilized | |
| Liperi (Pine) | 1.1 | 1.3 | 26 | 23 |
| Ilomantsi (Pine) | 0.9 | 0.9 | 29 | 32 |
| Juuka (Spruce) | 1.2 | 1.5 | 26 | 24 |
| Savonranta (Spruce) | 0.9 | 1.2 | 27 | 25 |
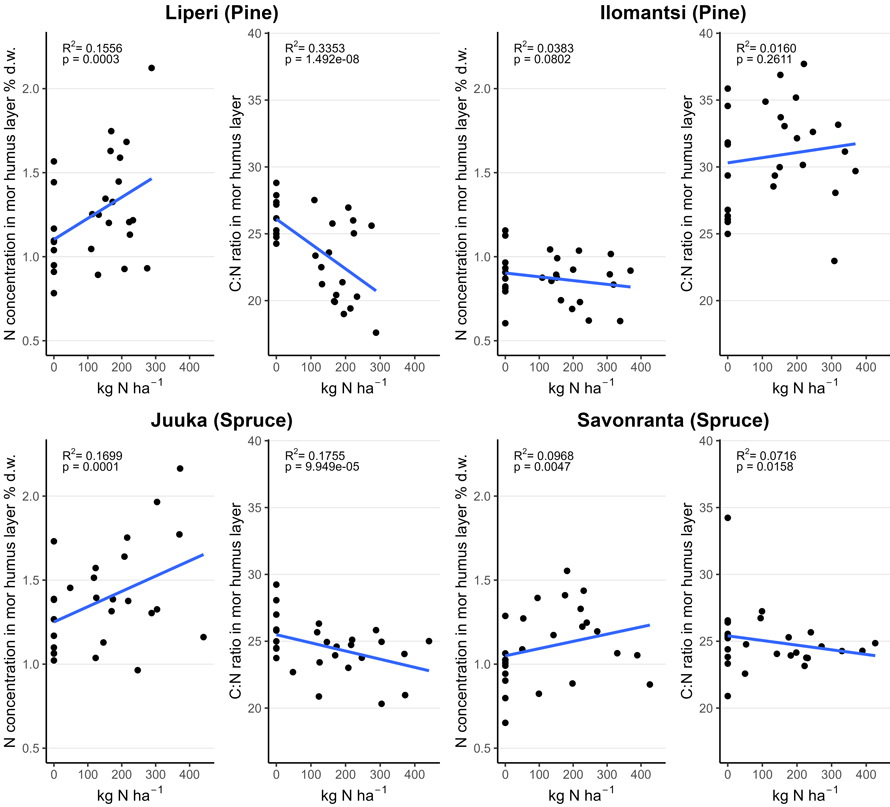
Fig. 4. Nitrogen (N) concentration (% of dry mass (d.w.)) and carbon to nitrogen (C:N) ratio in the mor humus layer in unfertilized and fertilized study plots (200 m2) as a function of the funnel-trap-observed N fertilizer dose.
| Table 4. The estimated amount of nitrogen (N) in the ground vegetation and mor humus layer kg ha–1 in 2022, three to four years after the fertilization. Statistically significant (p < 0.05) differences between the means of the unfertilized control plots and the fertilized plots within the research site are shown as bold text. | |||||||
| Research site | Treatment | Herbaceous plants | Dwarf shrubs | Mosses and lichens | All ground vegetation | Mor humus layer | All |
| Liperi | Control | 2.3 | 5.2 | 5.2 | 12.7 | 813.9 | 826.6 |
| Fertilized | 4.9 | 4.0 | 1.2 | 10.1 | 1117.0 | 1127.1 | |
| Ilomantsi | Control | 0.2 | 4.7 | 3.1 | 8.0 | 404.2 | 411.6 |
| Fertilized | 0.3 | 4.2 | 1.9 | 6.4 | 447.5 | 453.5 | |
| Juuka | Control | 3.2 | 1.2 | 7.4 | 11.8 | 683.2 | 695.0 |
| Fertilized | 2.2 | 0.8 | 7.1 | 10.1 | 752.8 | 762.8 | |
| Savonranta | Control | 2.8 | 1.4 | 7.5 | 11.8 | 489.1 | 500.9 |
| Fertilized | 3.6 | 0.6 | 5.3 | 9.5 | 588.5 | 598.0 | |