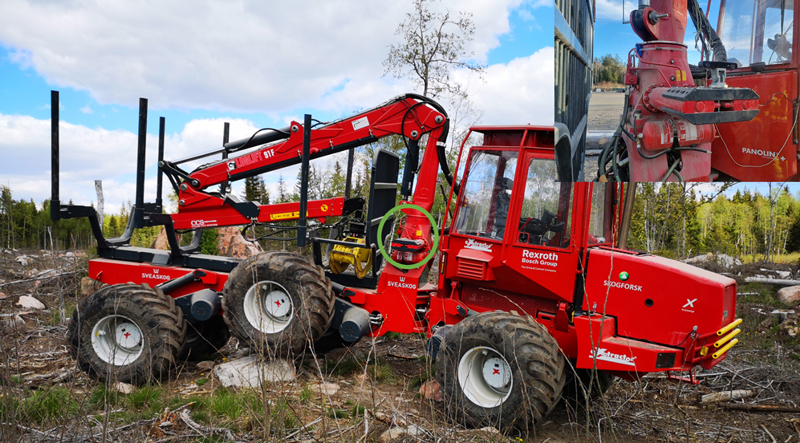
Fig. 1. The XT28 Forwarder and the mounting position of the stereo camera (green circle, close-up to the right).
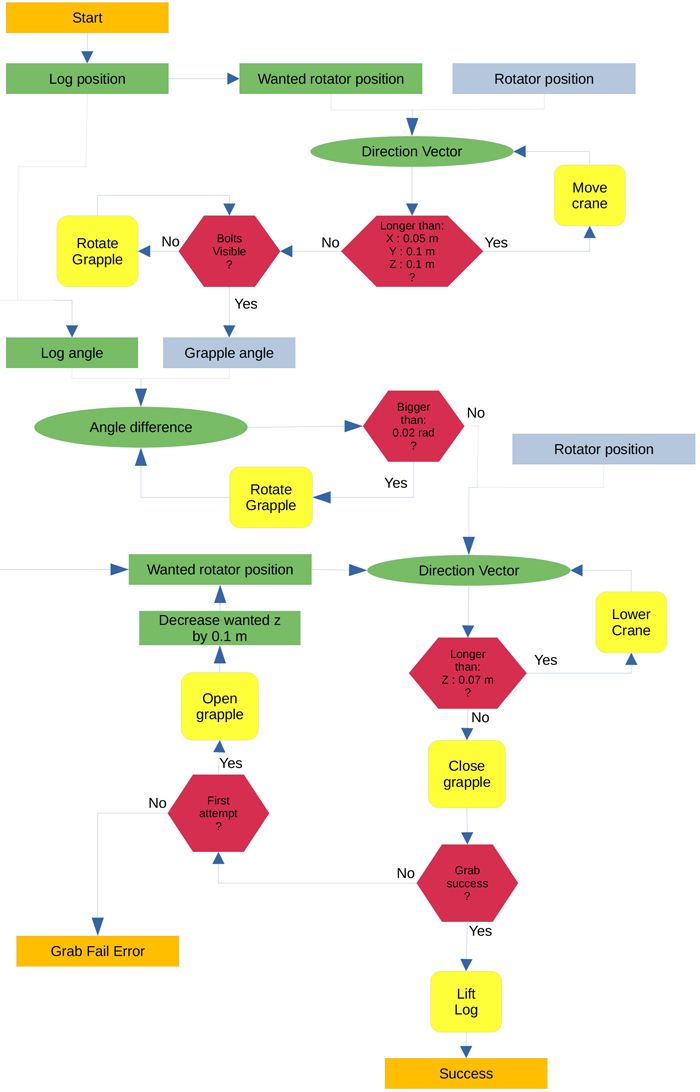
Fig. 2. Flow chart of the control system logic. Input and outputs are orange, detected objects (rectangles) or calculated targets (ovals) are green, terms are red, actual detected boom positions are grey, movement is yellow. A detected log and positioned rotator give a calculated movement vector.
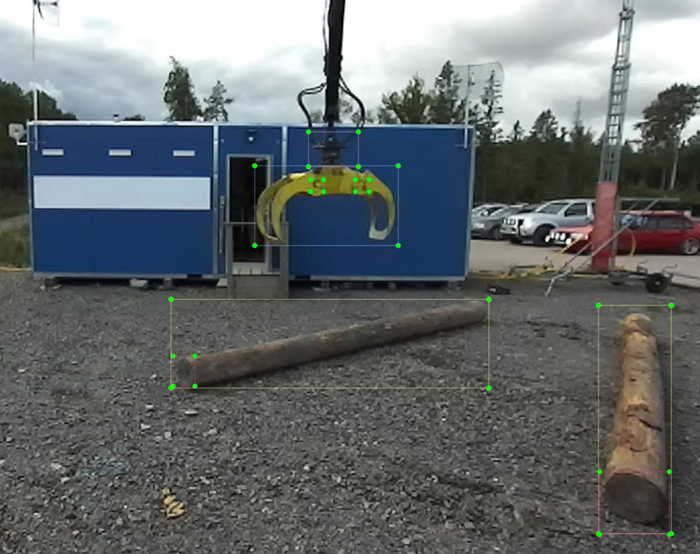
Fig. 3. Five objects, two shank-bolts on the grapple, the rotator, logs, and visible log ends were tagged in approximately 500 images to train object detection.
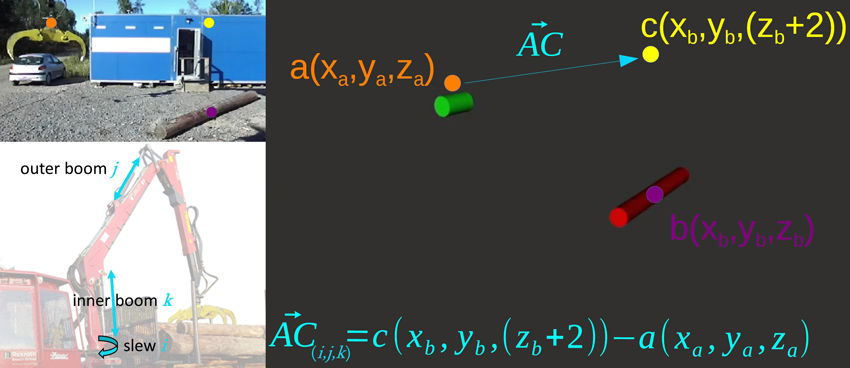
Fig. 4. The centre point of the rotator (a, orange), the log centre (b, purple), and the target position 2 m above the log (c, yellow). AC(i,j,k) is the vector of the boom movement based on the present position and used as control signals to the boom where component i goes to slew, component j goes to the outer boom and component k goes to the inner boom.
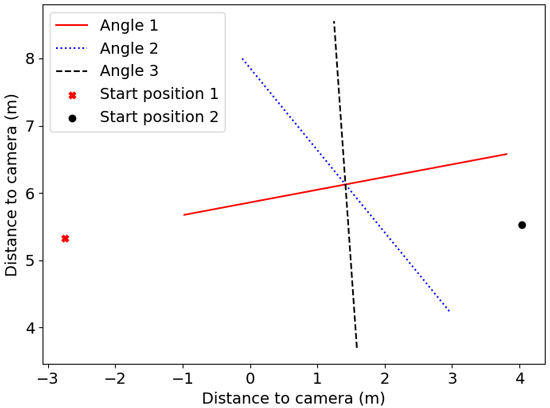
Fig. 5. Set up of Test 1 with start positions of the grapple (points) and different log angles (lines). The logs are placed in front of the camera on the left side of the machine. Angle 1 = 11°, Angle 2 = 129° and Angle 3 = 94°.
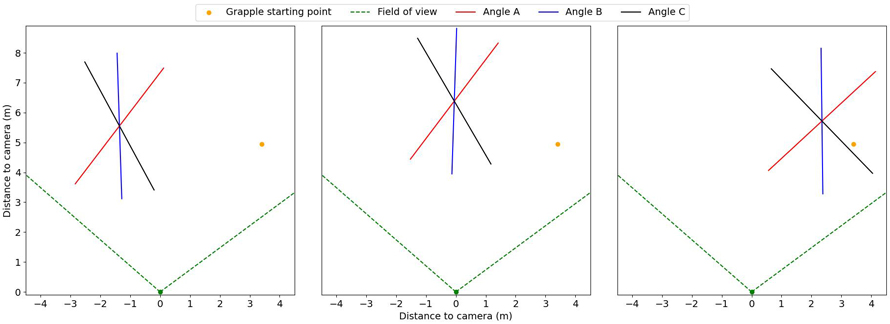
Fig. 6. The location and angles of the logs (lines) in relation to the camera view (green dotted lines). The orange dot shows the starting position of the grapple. View larger in new window/tab.
| Table 1. Results of Test 1 – repeatability. Number of trials (n) of movements from two different starting positions to estimated log centre when the log is placed in three different angles, distance (cm) from the arithmetic mean point of individual pick-up positions to log centre, standard deviation (STDAV (cm)), minimum/maximum distance from mean point to pick-up points (cm), and distance (cm) from the arithmetic mean point to log centreline. | |||||
| n | Mean point to log centre (cm) | STDAV (cm) | Min/Max distance from mean point (cm) | Mean point to log centreline (cm) | |
| Angle 1 (11°) | 20 | 24 | 7.3 | 2/16 | 21 |
| Angle 2 (129°) | 19 | 73 | 9.6 | 4/14 | 36 |
| Angle 3 (94°) | 19 | 83 | 8.5 | 3/42 | 16 |
| Angle 3 deviating point excluded | 18 | 84 | 6.6 | 3/15 | 18 |
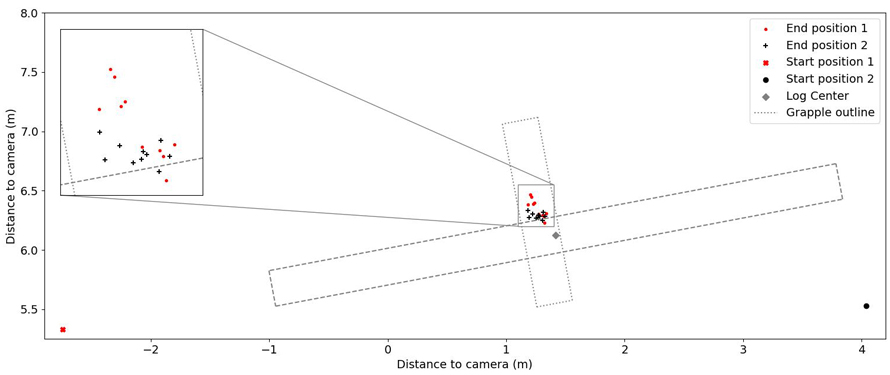
Fig. 7. Test 1, angle 1. Log and grapple positions. The axes show distance in metres to the camera. The starting positions are represented by large symbols and the end positions with small symbols. The log outline is represented by a dashed line. View larger in new window/tab.
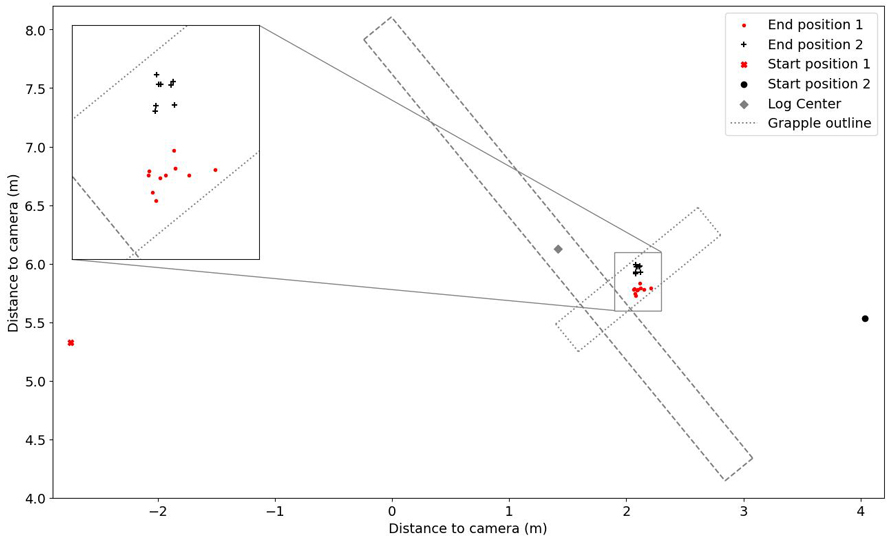
Fig. 8. Test 1, angle 2. Log and grapple positions. The axes show distance in metres to the camera. The starting positions are represented by large symbols and the end positions with small symbols. The log outline is represented by a dashed line. View larger in new window/tab.
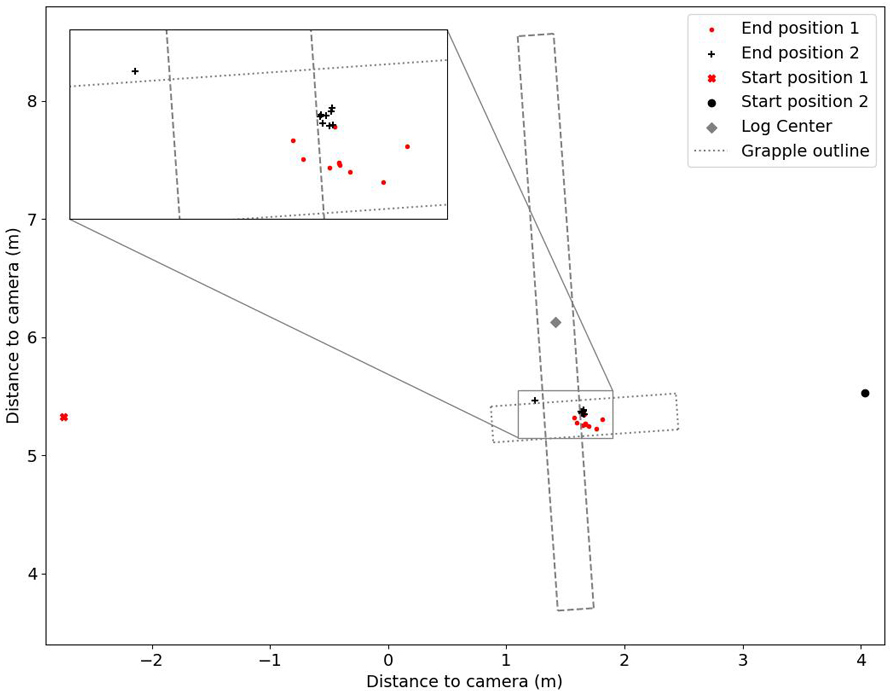
Fig. 9. Test 1, angle 3. Log and grapple positions. The axes show distance in metres to the camera. The starting positions are represented by large symbols and the end positions with small symbols. The log outline is represented by a dashed line.
| Table 2. Results of Test 2 – pick-up success. The number of attempts that succeeded at first or second trials are presented, as well as the failures for each position and angle. Angle A was 53°, 53°, and 43° for position 1, 2, and 3, respectively. Angle B was 92°, 88°, and 91° and Angle C was 118°, 120° and 134° for position 1, 2 and 3, respectively. | |||||||||
| Angle A | Angle B | Angle C | |||||||
| Success 1st attempt | Success 2nd attempt | Failures | Success 1st attempt | Success 2nd attempt | Failures | Success 1st attempt | Success 2nd attempt | Failures | |
| Position 1 | 1 | 2 | 2 | 0 | 4 | 1 | 0 | 4 | 1 |
| Position 2 | 0 | 5 | 0 | 0 | 5 | 0 | 1 | 4 | 0 |
| Position 3 | 2 | 3 | 0 | 1 | 4 | 0 | 0 | 1 | 4 |