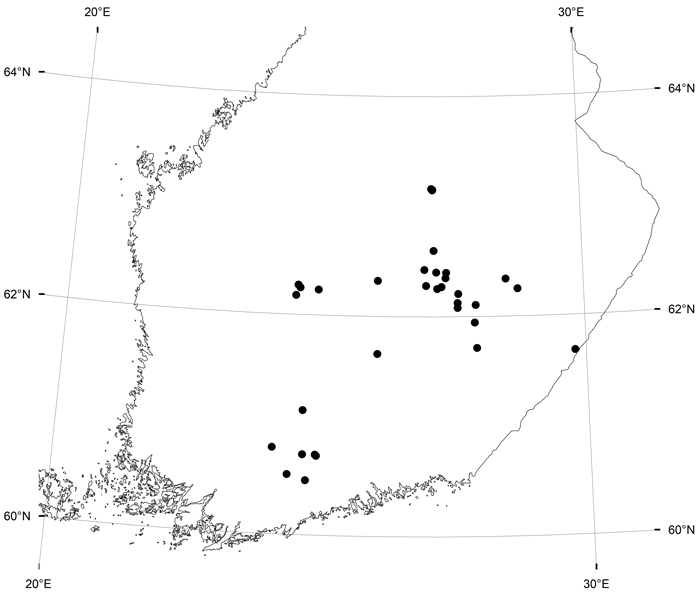
Fig. 1. The locations of the 34 tree breeding field trials of silver birch in southern and central Finland.
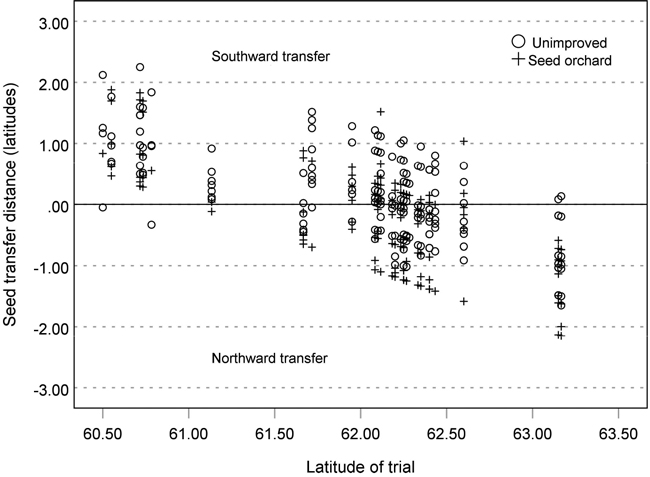
Fig. 2. Latitudinal seed transfer distances of the seed orchard and unimproved progenies tested in the 34 silver birch field trials in southern and central Finland.
| Table 1. The 19 silver birch seed orchards represented in the 34 common-garden trials. Origin means the geographical origin of seed orchard clones in Finland. | ||||||||
| Orchard | Alias | Origin | Type | Clones | Area ha | Establishment year, production years | Trials | Offspring |
| 288 | South-Central | Seedling | 120 | 0.14 | 1972, 1973–1978 | 3 | 1491 | |
| 336 | Central | Clonal | 115 | 0.14 | 1977, 1979–1987 | 19 | 23 715 | |
| 362 | JR-1 | Southern | Clonal | 2 | 0.03 | 1979, 1982–1996 | 26 | 1493 |
| 363 | JR-1 | Southern | Clonal | 2 | 0.04 | 1985, 1986–1993 | 26 | 1493 |
| 364 | Southern | Seedling | 50 | 0.08 | 1985, 1987–1991 | 10 | 3334 | |
| 373 | Central | Clonal | 47 | 0.15 | 1987, 1989–1996 | 15 | 13 714 | |
| 377 | JR-1 | Southern | Clonal | 2 | 0.05 | 1989, 1992–1996 | 26 | 1493 |
| 378 | Southern | Clonal | 33 | 0.10 | 1989, 1992–1997 | 7 | 685 | |
| 379 | Central | Clonal | 32 | 0.20 | 1989, 1990–1993 | 4 | 578 | |
| 381 | Southern | Clonal | 35 | 0.10 | 1990, 1991–1998 | 4 | 566 | |
| 383 | JR-2 | Southern | Clonal | 2 | 0.06 | 1990, 1991–1998 | 19 | 1491 |
| 384 | JR-1 | Southern | Clonal | 2 | 0.06 | 1990, 1991–1998 | 26 | 1493 |
| 387 | Southern | Clonal | 41 | 0.05 | 1991, 1993–2003 | 3 | 348 | |
| 390 | Central-North | Clonal | 50 | 0.08 | 1992, 1994–2000 | 2 | 291 | |
| 393 | Central | Clonal | 69 | 0.07 | 1992, 1995–2002 | 2 | 2067 | |
| 422 | Central | Clonal | 78 | 0.14 | 1998, 2001–2004 | 8 | 516 | |
| 424 | Central | Clonal | 49 | 0.05 | 1992, 1995–2003 | 2 | 1456 | |
| 430 | Central | Clonal | 48 | 0.15 | 1998, 2001–2009 | 8 | 525 | |
| 431 | Southern | Clonal | 35 | 0.11 | 1999, 2003–2009 | 3 | 353 | |
| Table 2. Realised genetic gains from 19 silver birch seed orchards in tree height (H), stem diameter (DBH), stem volume (VOL), stem slenderness (HD) and number of ramicorn branches (NRAM) and forks (NFOR) as percentages of the unimproved mean. The standard errors of the gains are given within parentheses. The bold values were found significant at p < 0.05 of Dunnett’s test. In the seed orchard column, “JR-1” refers to the four seed orchards Nos. 362, 363, 377, and 384, while “JR-2” refers to seed orchard No. 383. | ||||||||||||
| Orchard | H | DBH | VOL | HD | NRAM | NFOR | ||||||
| JR-1 | 3.9 | (0.8) | 3.2 | (1.1) | 8.9 | (2.7) | 0.2 | (0.9) | –6.1 | (4.1) | –42.7 | (9.5) |
| JR-2 | 11.1 | (0.7) | 4.0 | (0.9) | 18.9 | (2.4) | 7.3 | (0.7) | –7.5 | (4.1) | –57.6 | (10.4) |
| 288 | 3.5 | (1.7) | 2.7 | (1.9) | 8.3 | (5.1) | 1.2 | (1.4) | –9.5 | (7.4) | –0.7 | (16.9) |
| 336 | 4.1 | (0.7) | 2.2 | (0.8) | 7.7 | (2.1) | 1.8 | (0.6) | –6.0 | (2.2) | –3.6 | (4.1) |
| 364 | 3.8 | (1.0) | 3.5 | (1.3) | 11.7 | (3.2) | 0.7 | (0.9) | –9.3 | (3.8) | –10.4 | (8.3) |
| 373 | 6.8 | (0.8) | 5.3 | (0.9) | 17.4 | (2.3) | 1.6 | (0.6) | –9.2 | (2.3) | –11.0 | (3.9) |
| 378 | 4.2 | (1.1) | 0.6 | (1.4) | 6.1 | (3.5) | 4.2 | (1.1) | –14.4 | (7.7) | –4.7 | (11.4) |
| 379 | 3.6 | (1.3) | 3.3 | (1.6) | 11.2 | (4.3) | –0.4 | (1.3) | 1.6 | (8.8) | –3.8 | (14.6) |
| 381 | 6.7 | (1.3) | 3.8 | (1.6) | 13.6 | (4.3) | 3.3 | (1.3) | 11.6 | (8.4) | 4.3 | (13.8) |
| 387 | 7.4 | (1.6) | 6.1 | (1.9) | 18.2 | (4.9) | 1.1 | (1.4) | 4.7 | (7.9) | –41.1 | (18.2) |
| 390 | 1.9 | (2.2) | 1.7 | (2.1) | 1.0 | (7.3) | 4.5 | (2.4) | ||||
| 393 | 2.8 | (2.0) | 3.4 | (1.7) | 6.3 | (6.2) | 1.3 | (1.9) | ||||
| 422 | 5.1 | (1.1) | 5.3 | (1.3) | 14.1 | (3.6) | 1.0 | (1.1) | –6.4 | (7.4) | –34.1 | (17.0) |
| 424 | 1.6 | (2.0) | 2.5 | (1.7) | 5.4 | (6.2) | 0.5 | (1.9) | ||||
| 430 | 7.0 | (1.1) | 9.4 | (1.3) | 23.9 | (3.6) | –1.0 | (1.1) | –26.7 | (8.4) | –9.1 | (14.7) |
| 431 | 12.8 | (1.6) | 9.2 | (1.9) | 31.1 | (4.8) | 3.5 | (1.4) | –10.9 | (8.4) | –17.6 | (15.5) |
| Average | 5.4 | 4.1 | 12.7 | 1.9 | –6.8 | –16.2 | ||||||
| Table 3. D-values from 19 silver birch seed orchards for tree height (H), stem diameter (DBH), stem volume (VOL), overall quality (OQns), branch quality (BQns), stem straightness (SSns), number of ramicorns (NRAMns) and number of forks (NFORns). The values indicate the probability of a randomly chosen seed orchard tree having a greater trait value than a random unimproved tree. In the seed orchard column, “JR-1” refers to the four seed orchards Nos. 362, 363, 377, and 384, while “JR-2” refers to seed orchard No. 383. | |||||||||
| Orchard | H | DBH | VOL | HD | OQns | BQns | SSns | NRAMns | NFORns |
| JR-1 | 0.60 | 0.55 | 0.56 | 0.50 | 0.58 | 0.62 | 0.52 | 0.48 | 0.34 |
| JR-2 | 0.77 | 0.56 | 0.63 | 0.63 | 0.71 | 0.73 | 0.63 | 0.48 | 0.27 |
| 288 | 0.59 | 0.54 | 0.56 | 0.52 | 0.57 | 0.56 | 0.53 | 0.47 | 0.50 |
| 336 | 0.61 | 0.53 | 0.55 | 0.53 | 0.57 | 0.57 | 0.52 | 0.48 | 0.49 |
| 364 | 0.60 | 0.55 | 0.58 | 0.51 | 0.53 | 0.53 | 0.54 | 0.47 | 0.47 |
| 373 | 0.68 | 0.58 | 0.62 | 0.53 | 0.59 | 0.61 | 0.54 | 0.47 | 0.47 |
| 378 | 0.61 | 0.51 | 0.54 | 0.57 | 0.60 | 0.59 | 0.56 | 0.45 | 0.49 |
| 379 | 0.60 | 0.55 | 0.58 | 0.49 | 0.58 | 0.59 | 0.56 | 0.50 | 0.49 |
| 381 | 0.68 | 0.56 | 0.59 | 0.56 | 0.57 | 0.62 | 0.52 | 0.53 | 0.51 |
| 387 | 0.69 | 0.59 | 0.62 | 0.52 | 0.52 | 0.51 | 0.35 | ||
| 390 | 0.55 | 0.53 | 0.51 | 0.58 | 0.61 | 0.57 | 0.52 | ||
| 393 | 0.58 | 0.55 | 0.54 | 0.52 | 0.56 | 0.58 | 0.54 | ||
| 422 | 0.64 | 0.58 | 0.60 | 0.52 | 0.60 | 0.63 | 0.59 | 0.48 | 0.38 |
| 424 | 0.54 | 0.54 | 0.54 | 0.51 | 0.58 | 0.56 | 0.53 | ||
| 430 | 0.68 | 0.64 | 0.66 | 0.48 | 0.62 | 0.56 | 0.46 | 0.41 | 0.47 |
| 431 | 0.81 | 0.64 | 0.71 | 0.56 | 0.53 | 0.47 | 0.44 | ||
| Average | 0.64 | 0.56 | 0.59 | 0.53 | 0.59 | 0.59 | 0.54 | 0.48 | 0.44 |
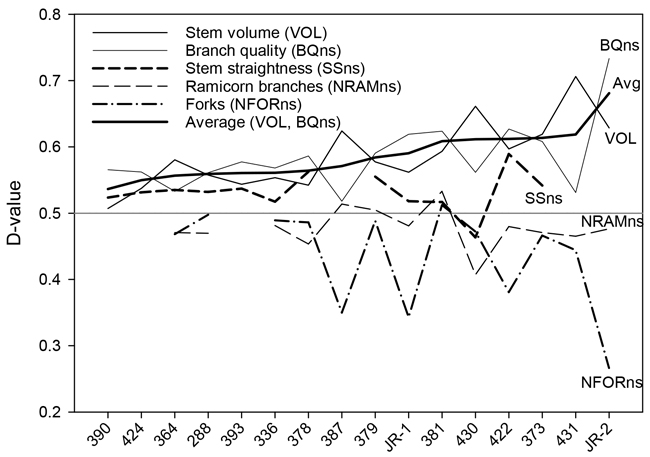
Fig. 3. D-values of the silver birch seed orchards for stem volume, branch quality stem straightness, number of ramicorns, and number of forks. The seed orchards are arranged in the ascending order of the average stem volume and branch quality D-values, reflecting the overall value of the orchard.
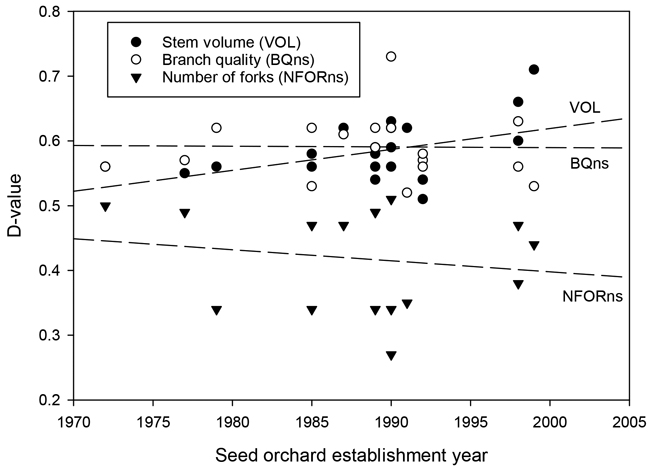
Fig. 4. The relationship between the establishment year of the silver birch seed orchard and the D-values for stem volume (VOL), branch quality (BQns), and the number of forks (NFORns).
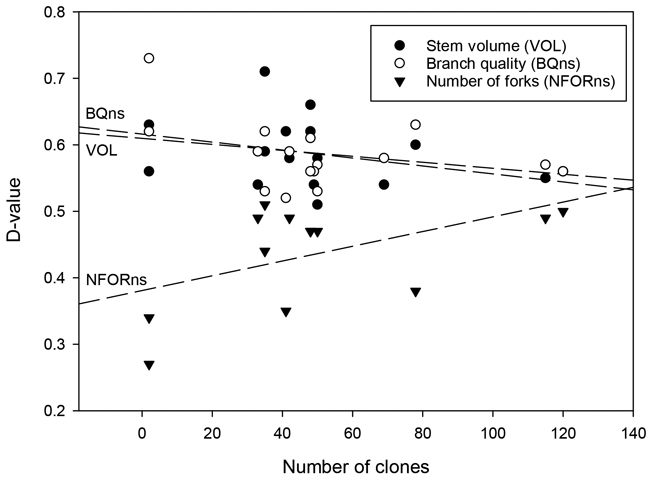
Fig. 5. The relationship between the number of clones in the silver birch seed orchards and the D-values for stem volume (VOL), branch quality (BQns), and the number of forks (NFORns).