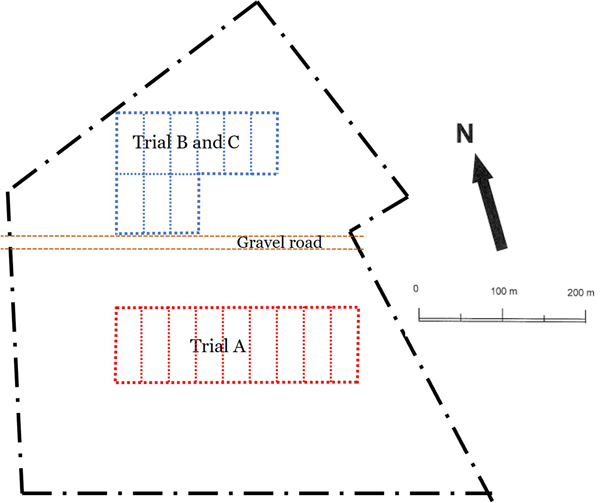
Fig. 1. Overview of seed orchard FP-512 Målilla, Sweden (57.37 latitude, 15.85 longitude) with the location of the three trials, each with nine blocks. Trial A was active throughout the studied period, Trial B was active until 2016, and Trial C began in 2017.
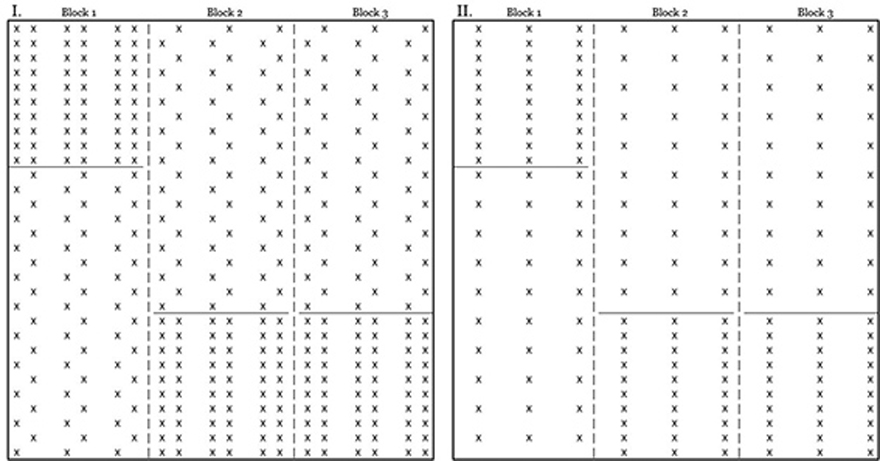
Fig. 2. Thinning trials in the Picea abies seed orchard FP-512 Målilla, Sweden. I. – Layout of the plots in three blocks (of nine) each in Trials A and B. II. – Layout of the plots in three blocks (of nine) in Trial C.
| Table 1. Treatments in the three thinning trials in the Picea abies seed orchard FP-512 Målilla in Sweden (57.37 latitude, 15.85 longitude). | |||
| Trial | Treatments | Cone data for years | |
| Trial A | Not thinned | 667 stems ha–1 | 2011, 2016, 2017, 2019–2022 |
| Thinned | 333 stems ha–1 | ||
| Trial B | Not thinned | 800 stems ha–1 | 2011, 2016 |
| Thinned | 400 stems ha–1 | ||
| Trial C | Not thinned | 400 stems ha–1 | 2019–2022 |
| Thinned | 200 stems ha–1 | ||
| Table 2. In the thinning trials A and B in the Picea abies seed orchard FP-512 Målilla, data collection 2011. Scoring classes for number of cones per tree and the number used for each class in the statistical analyses. | |||
| Cone scoring class | Number used | Cone scoring class | Number used |
| 0 | 0 | 41–80 | 60 |
| 1–10 | 5 | 81–160 | 120 |
| 11–20 | 15 | 161–320 | 240 |
| 21–40 | 30 | >320 | 480 |
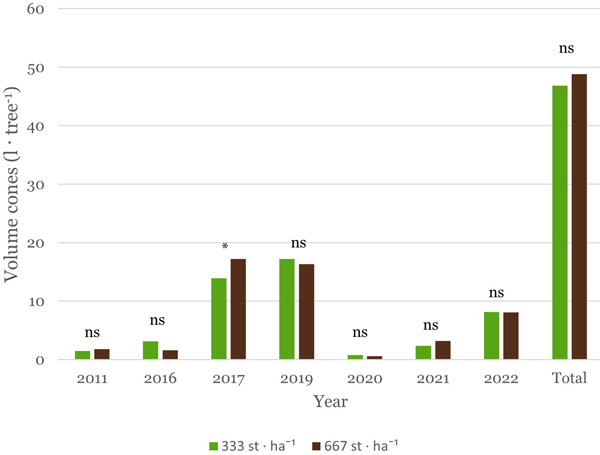
Fig. 3. In thinning Trial A in the Picea abies seed orchard FP-512 Målilla, Sweden. The volume of fresh cones per tree (l tree–1) in Trial A. Significance levels above the bars: ns – not statistically significant (p < 0.05); * – statistically significant (p < 0.05).
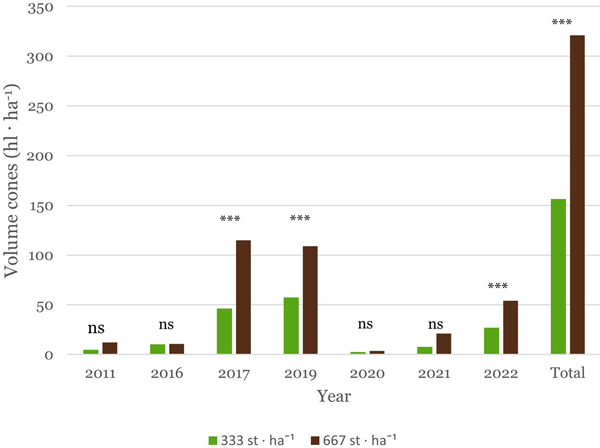
Fig. 4. In thinning Trial A in the Picea abies seed orchard FP-512 Målilla, Sweden. The volume of fresh cones per hectare (hl ha–1) in Trial A. Significance levels above the bars: ns – not statistically significant (p < 0.05); *** – statistically significant (p < 0.001).
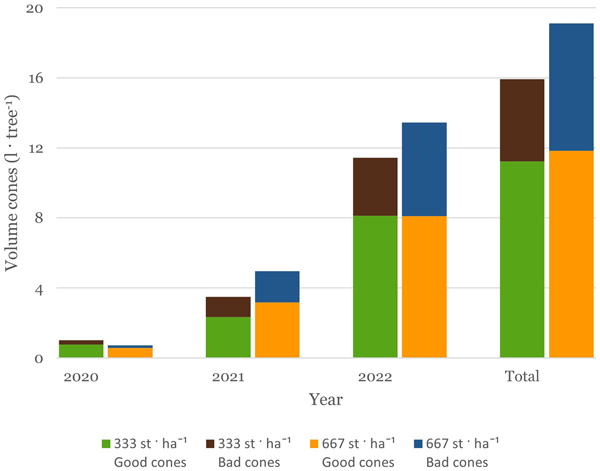
Fig. 5. In thinning Trial A in the Picea abies seed orchard FP-512 Målilla, Sweden. The total volume cones per tree (l tree–1) divided into good and bad cones in Trial A for the years 2020–2022.
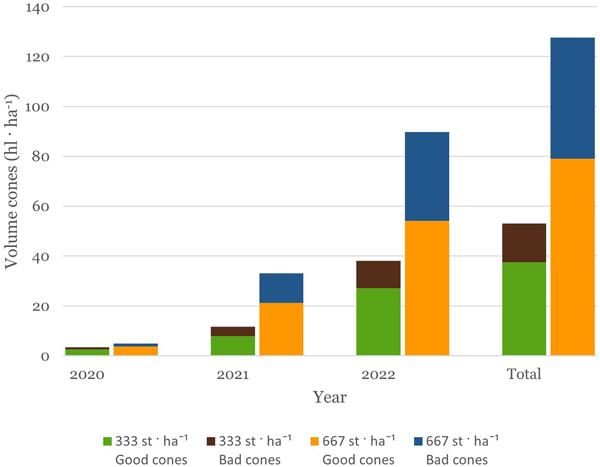
Fig. 6. In thinning Trial A in the Picea abies seed orchard FP-512 Målilla, Sweden. The total volume of cones per hectare (hl ha–1) divided into good and bad cones in Trial A for the years 2020–2022.

Fig. 7. In thinning Trial B in the Picea abies seed orchard FP-512 Målilla, Sweden. The volume of cones per tree (l tree–1) in Trial B. Significance levels above the bars: ns – not statistically significant (p < 0.05).
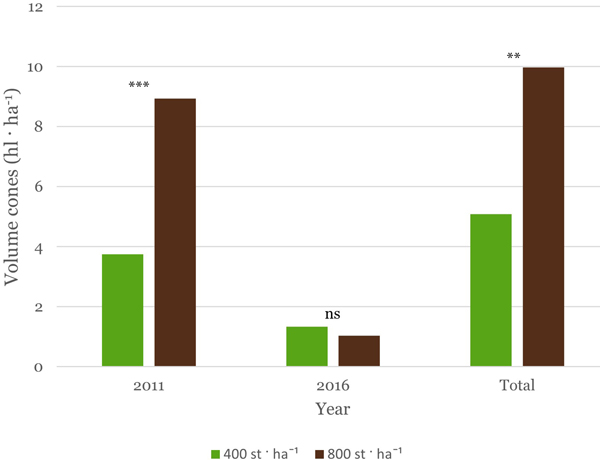
Fig. 8. In thinning Trial B in the Picea abies seed orchard FP-512 Målilla, Sweden. The volume of cones per hectare (hl ha–1) in Trial B. Significance levels above the bars: ns – not statistically significant (p < 0.05); ** – statistically significant (p < 0.01) ; *** – statistically significant (p < 0.001).
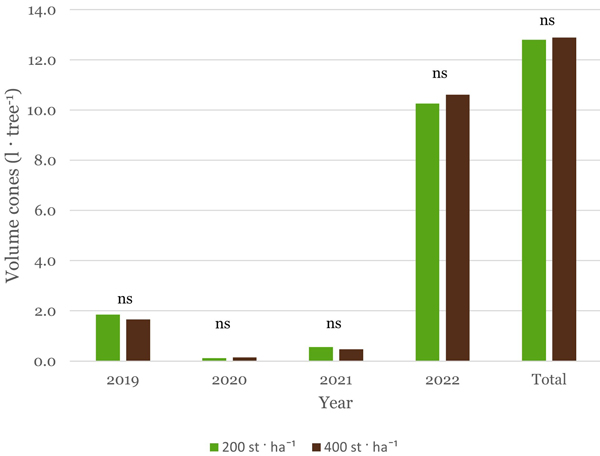
Fig. 9. In thinning Trial C in the Picea abies seed orchard FP-512 Målilla, Sweden. The volume of cones per tree (l tree–1) in Trial C. Significance levels above the bars: ns – not statistically significant (p < 0.05).
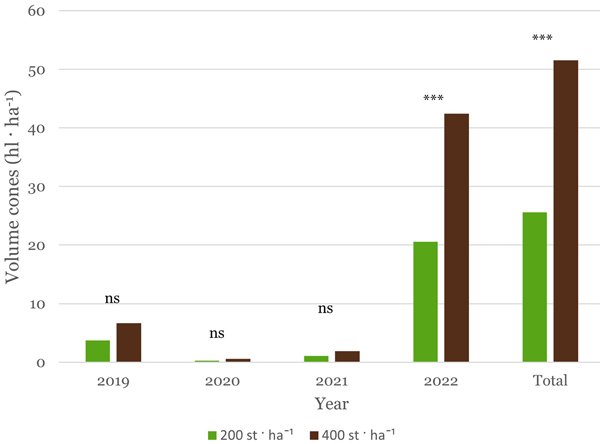
Fig. 10. In thinning Trial C in the Picea abies seed orchard FP-512 Målilla, Sweden. The volume of cones per hectare (hl ha–1) in Trial C. Significance levels above the bars: ns – not statistically significant (p < 0.05); *** – statistically significant (p < 0.001).
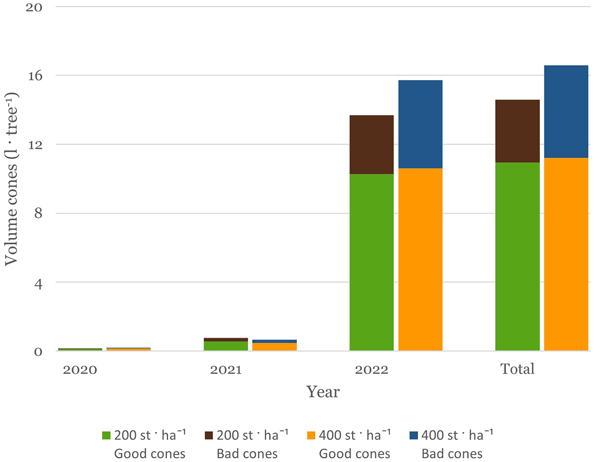
Fig. 11. In thinning Trial C in the Picea abies seed orchard FP-512 Målilla, Sweden. The total volume cones per tree (l tree–1) divided into good and bad cones in Trial C for the years 2020–2022.
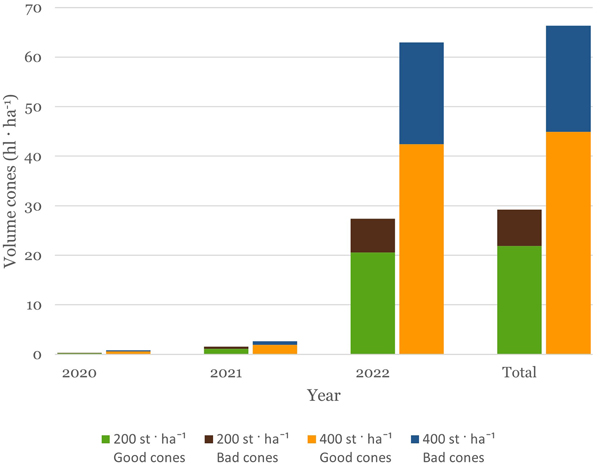
Fig. 12. In thinning Trial C in the Picea abies seed orchard FP-512 Målilla, Sweden. The total volume of fresh cones per hectare (hl ha–1) divided into good and bad cones in Trial C for the years 2020–2022.
| Table 3. In the thinning trials A and C in the Picea abies seed orchard FP-512 Målilla. Cone and seed quality data. Cones collected in autumn 2022. Traits with statistically significant differences (p < 0.05) are marked in bold. | ||||||||||
| Trial | Treatment | Cones per liter | Cone lenght (cm) | Seeds damaged by insects (%) | Empty seeds (%) | Filled seeds (%) | 1000 seeds weight (gr) | AP (%) (1) | Filled seeds per cone | Seeds per Kg |
| A | Thinned | 7.3 | 11.8 | 0.3 | 0.5 | 99.2 | 7.34 | 96 | 179 | 138 787 |
| A | Not thinned | 7.7 | 11.7 | 0.9 | 1.7 | 97.4 | 7.43 | 97 | 185 | 135 088 |
| C | Thinned | 8.0 | 11.5 | 0.9 | 1.0 | 98.1 | 7.09 | 96 | 174 | 141 142 |
| C | Not thinned | 7.7 | 11.5 | 0.6 | 1.4 | 98.0 | 6.82 | 97 | 196 | 146 642 |
| (1) AP – anatomic potential, a value corresponding to germination capacity (Simak 1980). | ||||||||||