| Table 1. Summary of studies that have used remotely sensed data to investigate boreal post-disturbance forest recovery prior to opening of Landsat archive in 2008. NDVI: Normalized Different Vegetation Index; NPP: Net Primary Productivity; NBR: Normalized Burn Ratio; NDSWIR: Normalized Difference Shortwave Infrared Index; EVI: Enhanced Vegetation Index, TCB: Taseled Cap Brightness; TCW: Taseled Cap Wetness; TCG: Taseled Cap Greenness; NIR: Near Infrared; NDWI: Normalized Difference Wetness Index; FRI: Forest Recovery Index; FVC: Fractional Vegetation Cover; SAVI: Soil Adjusted Vegetation Index; NDMI: Normalized Difference Moisture Index. | ||||||
| Study | Location/ extent | Sensor | Spatial resolution | Temporal resolution | Spectral index | Key findings |
| Kasischke and French (1997) | Alaska boreal | AVHRR | 1 km | 1990–1992 Chrono-sequence | NDVI | Sample based: 14 fires ranging in size from 400 to 16 900 ha. Patterns of pre-fire vegetation cover influence patterns of post-fire regrowth. Early season fires recovered more rapidly. Strong seasonal impact on NDVI that differs by forest type. |
| Amiro et al. (2000) | Canada boreal | AVHRR | 1 km | 1994 Chrono-sequence | NPP | Sample based: 502 fires that were > 1000 ha; ~7 Mha. NPP derived from Boreal Ecosystem Productivity Simulator (BEPS) model. BEPS uses AVHRR-derived LAI and land cover as model inputs. Linear increase in NPP 15 years post-fire. Forested areas had larger and more rapid increases in NPP than and tundra-dominated ecoregions. |
| Hicke et al. (2003) | Canada boreal | AVHRR | 8 km | 1982–1998 Monthly AVHRR composites | NPP | Sample based: 61 fires > 100 000 ha. NPP derived from Carnegie-Ames-Stanford Approach (CASA). CASA uses fAPAR from NDVI. 9 years for NPP in the most severely burned pixels to return to pre-fire levels. Forests of the Alaska boreal interior recovered more slowly than those of Taiga Plains. |
| Epting and Verbyla (2005) | Alaska boreal | Landsat | 30 m | 1986 (pre-fire), 1988, 1991, 1994, 2000, 2002 | NDVI, NBR | 1 fire, 17 000 ha. Unburned control areas. NDVI and NBR peaked 14 years post-fire, neither returned to pre-fire levels by 2002 (end of time series). More rapid recovery in more severely burned areas. Recovery rate varied by forest type. Self-replacement was the dominant successional pathway. |
| Goetz et al. (2006) | Canada boreal | AVHRR | 8 km | 1981–1997 Analysis focused on 1981,1989, and 1995 | NDVI | Sample based: 327 fires > 64 000 ha, ~4Mha. Unburned control areas. 5 years for NDVI to return to pre-fire levels (related primarily to establishment of herbaceous vegetation post-fire). No differences in recovery rates noted between different regions. |
| Cuevez-Gonzalez et al. (2009) | Siberia boreal | MODIS | 1 km | 2001–2005 Chrono-sequence | NDVI, NDSWIR | Sample based: 78 fires, ~781 400 ha; Unburned control areas. >13 years for NDVI and NDSWIR to return to pre-fire levels. NDVI recovered more rapidly than NDSWIR. Differences with Goetz et al. (2006) attributed to spatial resolution differences, bandwidth and spectral response differences in R and NIR between MODIS and AVHRR, and more extreme growing conditions in the boreal. |
| Jin et al. (2012) | Canada boreal | MODIS | 500 m | 2001–2011 | EVI | Sample based: 1346 fires > 100 ha in size. By 5–8 years after fire, summer EVI for all severity classes had recovered to within 90%–108% of pre-fire levels. More rapid recovery in more severely burned areas; differences in recovery rates between Boreal and Taiga Shield ecozones. |
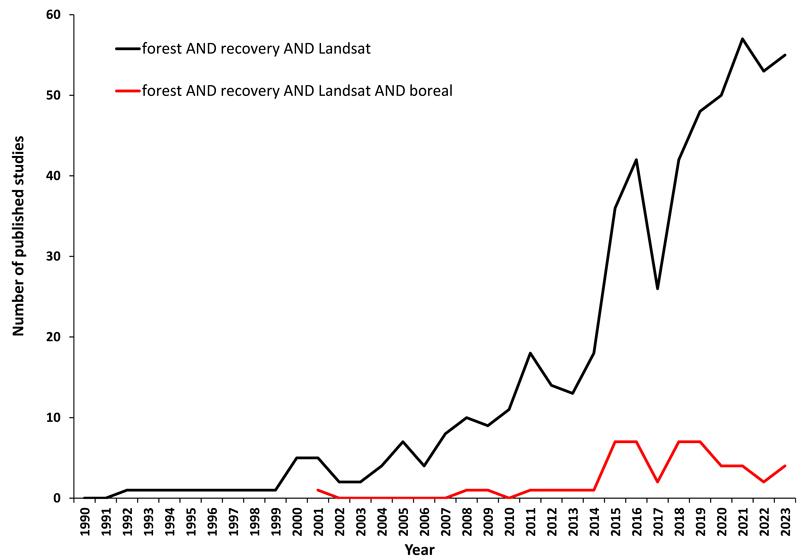
Fig. 1. Number of published research studies using Landsat data to investigate forest recovery globally, and in boreal forests specifically. Search terms included (“forest” AND “recovery” AND “Landsat”) or (“forest” AND “recovery” AND “Landsat” AND “boreal”) within the article title, abstract, and keywords (Source: Scopus:2023-12-14).
| Table 2. Summary of studies that have investigated the use of Landsat time series (LTS) data to characterize post-disturbance recovery in North American boreal forests following the opening of the Landsat archive in 2008. For a complete list of spectral index acronyms, see Table 1. | |||
| Study | Data | Spectral index | Key findings |
| Madoui et al. (2015) | Landsat images 1985, 1995, 2000, 2005 | N/A | Sample-based: study area contained 316 000 ha of wildfire and 417 000 ha of harvesting. Recovery assessed by land cover transitions for 1985, 1995, 2000, and 2005.Revegetation rates (transition to forest classes) more rapid post-harvest than post-fire and broadleaf was more common after harvest than fire. |
| Frazier et al. (2015) | LTS (1985–2012) | TCB, TCW, TCG | Sample-based: 8 Landsat scenes, ~20 Mha; no differentiation by disturbance type. Stronger recovery response in eastern Boreal Shield compares to western. Different indices relate to short- (TCG) and longer-term (TCW) recovery. |
| Pickell et al. (2016) | LTS (1985–2010) | NBR, NDVI, TCG, NIR | Sample based: 40 Landsat scenes representing 136 Mha. No differentiation by disturbance type. Recovery defined as number of years required for a pixel to return to 80% of its pre-disturbance value. Slowest for NBR, 5.6 years; fastest for TCG, 1.7 years. NDVI, TCG indices more sensitive to herbaceous vegetation and saturate rapidly post-disturbance. |
| White et al. (2017) | LTS (1985–2010) | NBR | Wall-to-wall; 650 Mha of forested ecosystems; wildfire and harvest; both short and long-term (Y2R) metrics of recovery were applied in a wall-to-wall assessment of recovery; Y2R recovery rates differed for wildfire (10.6 years, SD = 5.6 years) and harvest (6.6 years, SD = 3.9 years) Time since disturbance is important for interpreting spectral measures of forest recovery. Recovery rates varied by ecozone. |
| Frazier et al. (2018) | LTS (1986–2006) | TCG, TCW, TBR | Wall-to-wall within Boreal Shield and Taiga Shield ecozones. Post-fire short-term (@ 5 years) recovery rates increased by 18% in the Taiga Shield East and 9% in the Taiga Shield West. Recovery rates in the Boreal Shield varied temporally and were not consistently positive or negative. |
| Hermosilla et al. (2019) | LTS (1985–2015) | NBR | Wall-to-wall; 650 Mha of forested ecosystems of Canada; considered the impact of multiple disturbances on short-term recovery (i.e. at 5 years) following harvest and wildfire. Used Recovery Indicator of Kennedy et al. (2012). Compared recovery rates following multiple disturbances to those after only a single disturbance. More rapid (24%) short-term recovery from fires that burned previously harvested areas; slower (39%) short-term recovery when harvesting followed fire (salvage); fastest short-term recovery in areas disturbed by two harvest events. |
| Hird et al. (2021) | LTS (1985–2018) | NBR | Sample-based: Y2R for 57 979 harvested areas in Alberta, Canada; Mean Y2R = 8.7 years, average of 59.9% recovery after 5 years. Variability in Y2R by ecological subregions. |
| White et al. (2022) | LTS (1985–2017) | NBR | Wall-to-wall; 650 Mha of forested ecosystems of Canada. Recovery rates differed between fire (10.6 years, SD = 6.4 years) and harvest (6.1 years, SD = 4.6 years). Recovery rates varied by ecozone, disturbance type, pre-disturbance land cover, and latitude. Overall, 87% and 97% of recovered pixels sampled in harvests and wildfires, respectively, had achieved at least one of the benchmarks, with benchmarks of height more readily achieved than benchmarks of cover. ~4% of areas disturbed by wildfire or harvest had significant positive spatial clustering, indicative of slower spectral recovery rates; these areas were also less likely to have attained benchmarks of height and cover. Conversely, significant negative spatial clustering was identified for 0.94% of areas recovering from harvest and 1.93% of areas recovering from wildfire, indicative of spectral recovery that was more rapid than the ecozonal baseline. |
| White et al. (2023) | LTS (1985–2017) | NBR | Plots that experienced rapid spectral recovery were associated with a transition from conifer to broadleaf or were broadleaf pre-fire. Plots that experienced a decrease in stem density took significantly longer to spectrally recover than plots that experienced no change in stem density. Plots that had not yet spectrally recovered by the end of the time series were associated with higher elevations, drier sites, greater pre-fire basal area, and had the greatest change magnitude. Knowledge of pre-fire condition is important for characterizing and interpreting measures of post-fire spectral recovery for forest management applications. |
| Table 3. Summary of studies that have investigated the use of Landsat data (30 m) to characterize post-disturbance recovery in Eurasian boreal forests following the opening of the Landsat archive in 2008. For a complete list of spectral index acronyms, see Table 1. | |||
| Study | Data | Spectral index | Key findings |
| Potapov et al. (2015) | LTS (1985–2012) | NDVI, NDWI | Wall-to-wall, Eastern Europe: 59 539 images from 527 Landsat scenes representing 600 million ha. No atmospheric correction; used MODIS to generate normalized anisotropy-adjusted reflectance values. Recovery defined as canopy cover ≥ 49% by 2000 and 2012. More than 60% of the total area of forest loss that occurred prior to 2007 had recovered by 2012, and this rate was more than 85% for pre-1988 loss areas. Recovery could not be assessed annually due to data gaps and low tree canopy cover model stability in data poor years and regions. |
| Chu et al. (2016) | LTS (1995–2014) WorldView-2 panchromatic (2010) Ground plots | FRI, FVC | Post-wildfire forest recovery in larch forests for a single fire, 28 000 ha. Used unburned control areas as reference. WorldView-2 images used to sample pure vegetation and bare soil conditions for FRI and FVC calculation. Forest Recovery Index (FRI; considered a long-term measure of recovery) can be used for regrowth assessment after 10 years post-fire, which overlaps with marked increase in larch sapling stem volume; FRI returns to pre-fire condition after 30–47 years, depending on burn severity. Fractional Vegetation Cover (FVC) more suitable for assessing short-term recovery (i.e. within 10 YSF); increases rapidly within 5 YSF (associated with herbaceous vegetation). Mean recovery rates: FVC = 6 years; FRI = 20 years.Faster short-term recovery observed in areas with higher burn severity. Fourteen 50×50 m field plots at different burn severities; field data acquired at 11–18 YSF; used for qualitative assessment only. |
| Chu et al. (2017) | LTS (1998–2014) | FRI, FVC | Builds on work of Chu et al. (2016) and attempts to identify drivers of post-fire recovery using pre-fire land cover, burn severity, pre-fire forest condition, distance to water body, elevation, solar insolation, slope, soil moisture. Only 51% of variation in FVC recovery rates were explained by the identified drivers; burn severity (classes) most important predictor of recovery rate, followed by elevation and distance to water. Only 41% of FRI explained by these predictors (burn severity, distance to water, and pre-fire NDVI as primary drivers). |
| White et al. (2018) | LTS (1985–2012) ALS | NBR | Finland, post-harvest; validation of spectral recovery (Y2R) with ALS; 55% of pixels recovered within 10 years post-harvest. 89% of spectrally recovered pixels had achieved benchmarks of both height and cover measured from ALS data. Rapid recovery associated with taller trees at time of ALS measurement than slow recovery. |
| White et al. (2019) | LTS (1985–2012) Ground plots | NBR | Finland, post-harvest; validation of spectral recovery (Y2R) with 284 field plots (radius = 9 m). Mean height, dominant species, and the percentage of deciduous stems in the plot were most important factors influencing spectral recovery rates. Variability in stand establishment made it challenging to accurately discriminate among recovery rates within 10 years post-harvest. |
| Shvetsov et al. (2019) | LTS (1998–2017) | NBR | Post-fire recovery in southern Siberia; Sample-based: 97 samples sites, each 2–4 ha in size. Fire frequency, fire severity, and surface temperature anomalies explain 58% of the variation in recovery rates; recovery rate measured as slope of linear fit between NBR (dependent) and time since disturbance (independent). At least 7 NBR values used to fit the model.Strong positive correlation (R = 0.71) observed between field-measured log-transformed seedling density and NBR slope. Faster recovery in more severely burned areas. |
| Hislop et al. (2020) | MODIS (MCD64A1) 2001–2018 LTS (1991–2019) | NBR | Sample-based, post-fire recovery in boreal and temperate forests in Australia, Canada, Chile, China, Russia, USA and Mediterranean. MODIS used to map burns and guide selection of Landsat scene samples; LTS used to assess recovery. Strata defined by country, biome, and year and 500 Landsat pixels selected at random per stratum. dNBR used as continuous measure of magnitude/severity. Short-term recovery at 5 years post-disturbance; Recovery Indicator (RI) after Kennedy et al. (2012). Boreal forests had only recovered an average of ~60% of their pre-fire NBR value at 5 years post-fire. |
| Senf and Seidl (2021) | LTS (1991–2018) Chrono-sequence | NDVI, EVI, SAVI, mSAVI, NDMI, NBR, NBR-2 | Wall-to-wall; 36 million disturbance patches (not discriminated by disturbance type). Chronosequence approach; recovery defined relative to pre-disturbance canopy cover (average canopy cover based on 5 years pre-disturbance). All spectral indices were used in a random forest regression model to estimate canopy cover. Recovery to pre-disturbance canopy cover for Europe achieved within 30 years; 18–23 years for Nordic countries (boreal).Recovery was > 10 times faster than disturbance on 69% of the forest area. A statistical model was used to extrapolate beyond the time series (i.e. for pixels not recovered within 28 year LTS). |
| Nolè et al. (2022) | MODIS (MCD43A4) (2002–2020) | NBR, NDVI | Pan-European assessment at 500 m spatial resolution of short-term (5 year) post-fire recovery using the NBR-derived Relative Recovery Indicator (RRI) and NDVI. RRI was scaled to disturbance magnitude. Variability across forest classes and bioregions. Severity assessed using the Relativized Burn Ratio (RBR); highest severity fires were located in the boreal region. NDVI = recovery within 2.5 years; higher variability in boreal. More rapid NDVI recovery with greater fire severity. Faster recovery rates for broadleaf and mixedwood forest types compared to conifer in boreal. RRI indicated recovery was incomplete at 5 years. |
| Table 4. Summary of studies that have used ALS data independently or have integrated LTS and ALS data to characterize boreal post-disturbance forest recovery. For a complete list of spectral index acronyms, see Table 1. | |||
| Study | Data | Spectral index | Key findings |
| Magnussen and Wulder 2012 | Airborne laser scanning data (2010) | N/A | 163 historic fires from Canadian National Large Fire Database. Incomplete fire consumption means that canopy heights could be a mixture of residual tree heights and recovering heights. Chronosequence approach, to identify regenerating canopy: mean annual height growth had to be less than a specified value (derived from unassociated plot data).Developed a least-squares polynomial between post-fire recovered canopy heights and years since fire. Based on expectation for growth. Statistically separated post-fire recovered canopy heights from pre-fire canopy heights. |
| Bolton et al. 2015 | LTS (1985–2010) Airborne laser scanning data (2010) | NBR | Post-fire; sample-based; 600 burned patches > 13 000 ha. Chronosequence of ALS-derived canopy height and cover. Pre-disturbance cover influenced post-fire structure.Canopy cover and height were significantly greater at 20–25 years post-fire for stands that were denser pre-fire. ALS metrics sensitive to residual canopy structures in the first 10 years post-fire. |
| Bolton et al. 2017 | LTS (1985–201) Airborne laser scanning data (2010) MODIS GPP (2000–2015) | N/A | Post-fire; 417 burned patches (1985–2009). 25-year chronosequence of canopy height & cover from ALS. Post-fire canopy cover related to GPP but only after 16–25 YSF (mean = 16.2–21.7%, SD = 16.0–17.1%), and correlations to GPP were stronger (r = 0.63–0.71, P < 0.0). Variability in height remained low at 16–25 YSF (mean = 4.9–5.0 m, SD = 0.9–1.1 m) and weakly related to GPP (r = 0.16–0.21). |