| Table 1. Description of fertilization experiments at the different study sites with climate and initial stand attributes. The mean annual air temperature and annual precipitation were 30-year averages from 1990 to 2020 (Finnish Meteorological Institute 2023). During the study period, the mean annual air temperature was 0.8 °C higher, and the annual precipitation slightly lower (592–667 mm) than the 30-year average (Finnish Meteorological Institute 2023). The stand characteristics were calculated as the averages of the 27 circular plots (trees with Dbh > 8 cm) for each study site. | ||||
| Study site | Liperi | Ilomantsi | Juuka | Savonranta |
| Location | 62.55846 N, 29.06265 E | 62.85543 N, 30.67705 E | 63.066199 N, 28.874640 E | 62.139028 N, 29.149086 E |
| Altitude (m above sea level) | 160 | 180 | 170–200 | 120–140 |
| Main tree species | Pinus sylvestris | Pinus sylvestris | Picea abies | Picea abies |
| Pinus sylvestris, Picea abies, Betula spp. volume (%) | 78.0, 19.3 and 2.7 | 86.0, 12.5 and 1.5 | 8.8, 86.6 and 4.6 | 11.6, 86.4 and 2.0 |
| Mean annual air temperature (°C) | 3.5 | 3.0 | 2.8 | 3.4 |
| Effective temperature sum (d.d.) | 1200–1300 | 1100–1200 | 1100–1200 | 1200–1300 |
| Annual precipitation (mm) | 640 | 644 | 661 | 670 |
| Initial stand attribute measurements | 24 May–7 Jun 2018 | 8–21 Jun 2018 | 13–22 May 2019 | 23–31 May 2019 |
| Fertilization | 27 Jun 2018 | 20 Jul 2018 | 25–27 Jul 2019 | 10 Aug 2019 |
| Stand density (stems ha–1) | 513 | 687 | 619 | 455 |
| Mean basal area (m² ha–¹) | 19 | 20 | 20 | 17 |
| Mean stand diameter (cm) | 23 | 18 | 21 | 21 |
| Initial stand volume (m3 ha–1) | 167 | 170 | 187 | 159 |
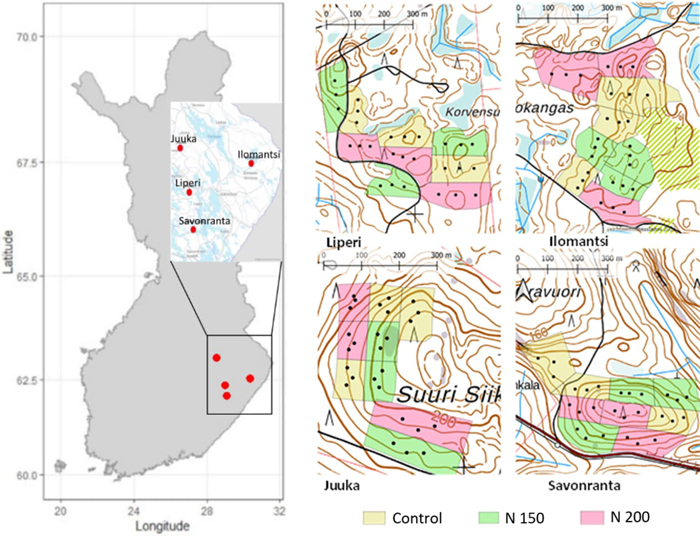
Fig. 1. Layout of the fertilization experiments using ground spreading in the Scots pine study sites at Liperi and Ilomantsi and helicopter spreading in the Norway spruce study sites at Juuka and Savonranta. Each of the three fertilization treatments (target doses of 0, 150 and 200 kg N ha–1) were applied to three replicate 1-ha blocks, each containing three circular plots (radius 7.98 m, area 200 m2).
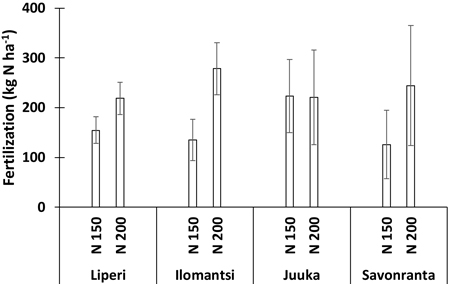
Fig. 2. Average ± standard deviation for measured fertilizer dose (kg N ha–1) over three blocks (each containing three circular plots) for each fertilization treatment delivered via ground spreading in the Scots pine study sites at Liperi and Ilomantsi and via aerial spreading in the Norway spruce study sites at Juuka and Savonranta in comparison to the fertilizer targets of 150 and 200 kg N ha–1.
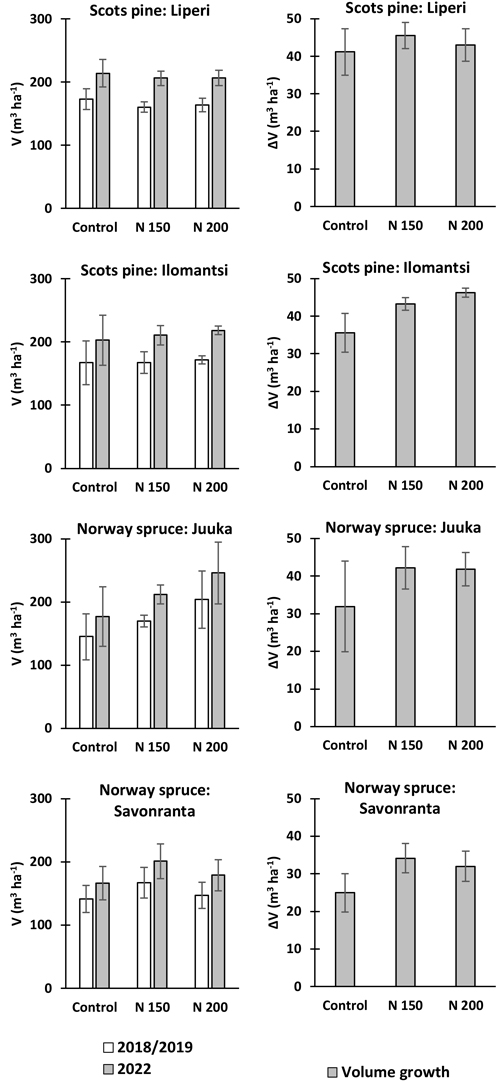
Fig. 3. Initial and final volume (V) of living trees at the end of the study period (left) and the corresponding volume growth (ΔV) of the trees (right) over three blocks (each containing three circular plots) for each fertilization treatment in the Scots pine study sites at Liperi and Ilomantsi and in the Norway spruce study sites at Juuka and Savonranta for fertilizer targets of 0, 150 and 200 kg N ha–1.
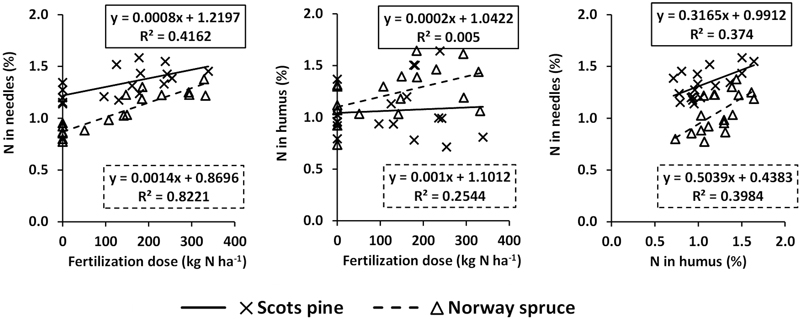
Fig. 4. Relationships between realised fertilizer dose based on block-level averages from the circular plots and measured concentrations of N in the needles (left) and the humus layer (middle) in the Scots pine and Norway spruce study sites, and the relationship between the humus and needle N concentrations (right). The optimal diagnostic level of needle N concentration is >1.5%.

Fig. 5. Volume growth (ΔV) as a function of fertilizer dose (top left), initial volume of living trees at the end of the study period (top right) and measured concentrations of N in the needles (bottom left) and humus layer (bottom right) in the Scots pine study sites (Liperi and Ilomantsi together) and in the Norway spruce study sites (Savonranta and Juuka together). Data points represent average values from the three circular plots in each block (three replicates per treatment).