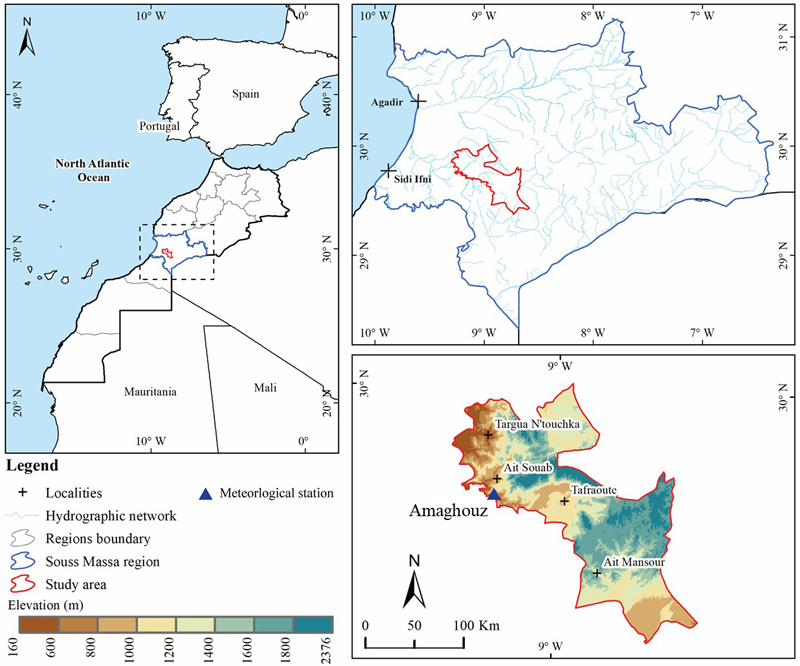
Fig. 1. The location and topography of the study area map.
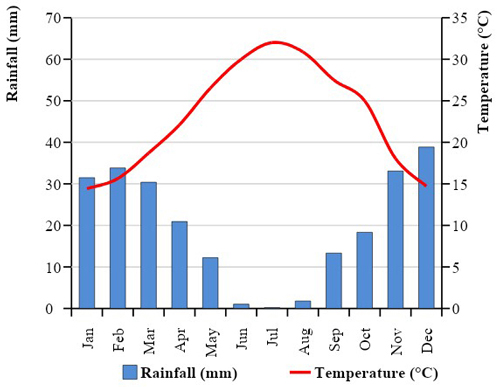
Fig. 2. Rainfall and temperature climatology of the GIAHS site based on observed data for the Amaghouz station for the period 1983–2022. Globally Important Agricultural Heritage Systems (GIAHS).
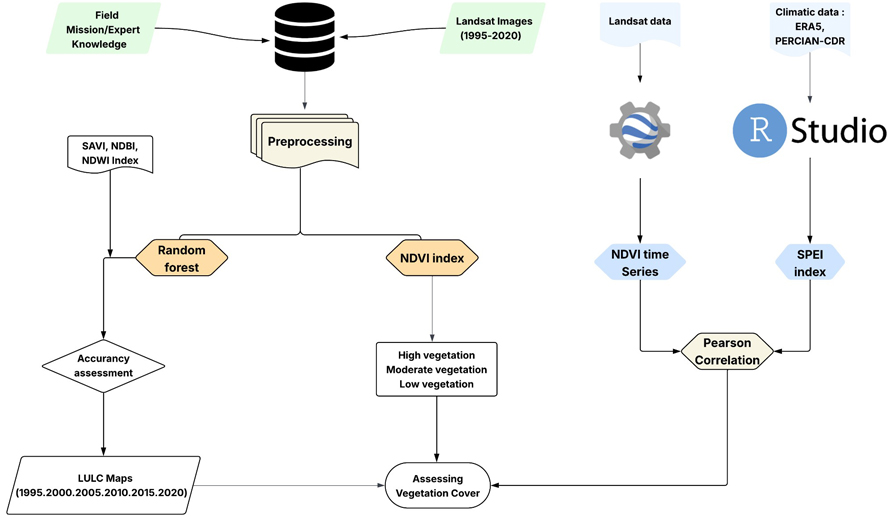
Fig. 3. Flowchart of the adopted methodology for assessing Drought and vegetation dynamics dynamics in GIAHS site. Globally Important Agricultural Heritage Systems (GIAHS), The spectral indices used include the Soil-Adjusted Vegetation Index (SAVI), Normalized Difference Built-up Index (NDBI), and Normalized Difference Water Index (NDWI). The classification was carried out using the Random Forest (RF) algorithm implemented in Google Earth Engine (GEE). LULC – Land Use and Land Cover; SAVI – Soil-Adjusted Vegetation Index; NDBI – Normalized Difference Built-up Index; NDWI – Normalized Difference Water Index; RF – Random Forest; OA – Overall Accuracy; Kappa – Kappa coefficient.
| Table 1. Classification of land cover types based on NDVI values for the GIAHS site. | |
| NDVI Values | Class description |
| NDVI < 0.03 | Bare land |
| 0.03 < NDVI < 0.3 | Low-density vegetation |
| 0.3 < NDVI < 0.4 | Moderate-density Vegetation |
| NDVI > 0.4 | High-density Vegetation |
| NDVI: Normalized Difference Vegetation Index; GIAHS: Globally Important Agricultural Heritage Systems (GIAHS). | |
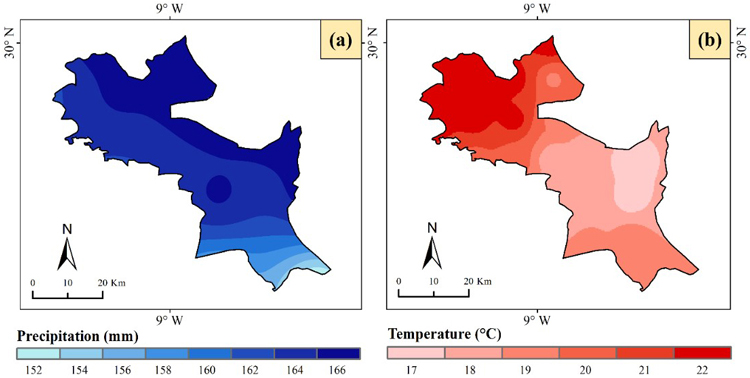
Fig. 4. Climatology of annual (a) precipitation and (b) temperature, in the GIAHS site from 1983–2020. Globally Important Agricultural Heritage Systems (GIAHS).
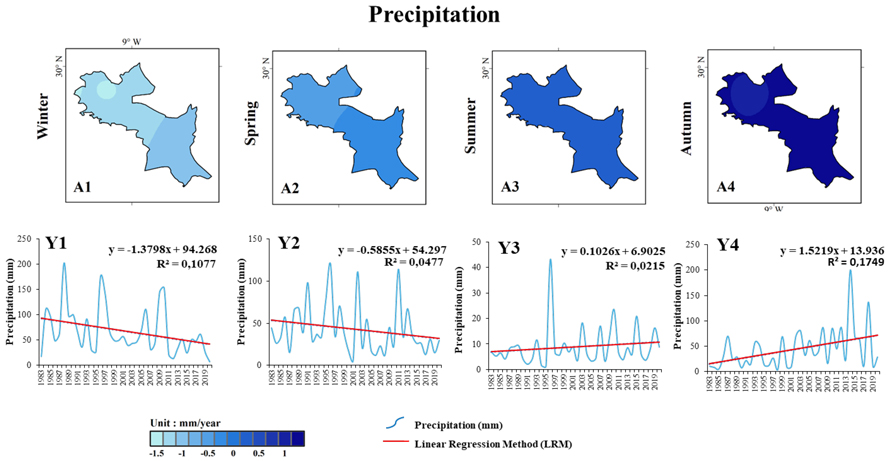
Fig. 5. Spatial-temporal changes in precipitation in the GIAHS site during 1983–2020. (A1–A4) show the seasonal spatial trends in precipitation (unit: mm/year) derived using the Linear Regression Method (LRM), while (Y1–Y4) represent the corresponding interannual variation and linear trends. Seasons are as follows: (1) Winter, (2) Spring, (3) Summer, and (4) Autumn. Globally Important Agricultural Heritage Systems (GIAHS). View larger in new window/tab.
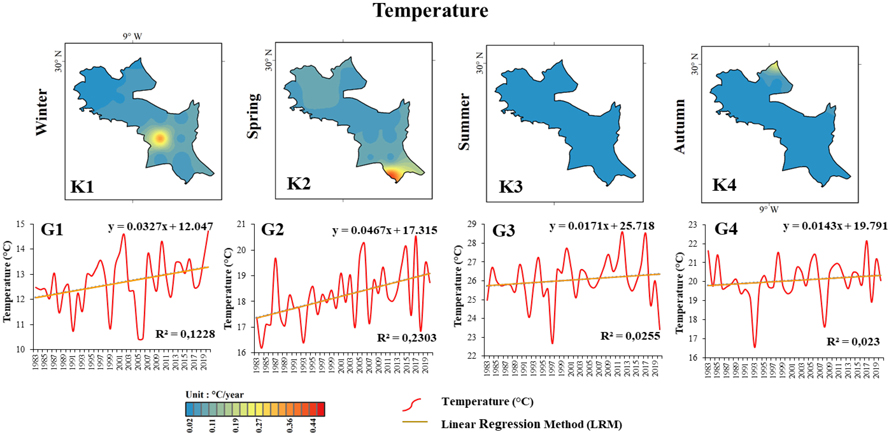
Fig. 6. Spatial-temporal changes in temperature in the GIAHS site during 1983–2020. (K1–K4) illustrate the seasonal spatial trends in temperature (unit: °C/year) using the Linear Regression Method (LRM), and (G1–G4) show the corresponding interannual variation and trends. Seasons are as follows: (1) Winter, (2) Spring, (3) Summer, and (4) Autumn. Globally Important Agricultural Heritage Systems (GIAHS). View larger in new window/tab.
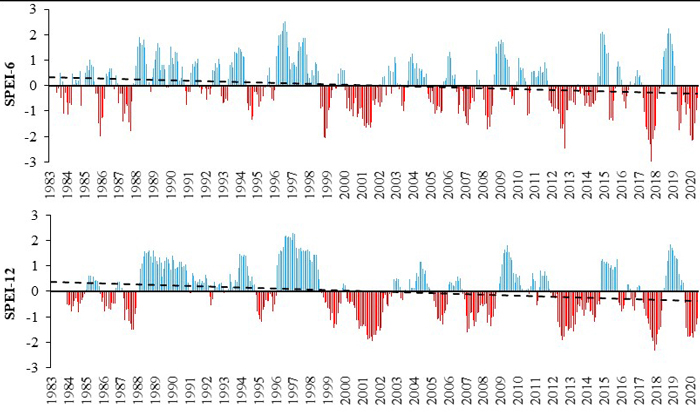
Fig. 7. Time series of changes in SPEI at the seasonal scale (SPEI-6) and annual scale (SPEI-12) from 1983 to 2020 in the GIAHS site. The Standardized Precipitation-Evapotranspiration Index (SPEI).
| Table 2. Confusion matrix and accuracy assessment of (LULC) classification for the GIAHS site. | ||||||
| Year | Ground truth | |||||
| 1995 | Classes | Agriculture | Woodland | Bare land | Built-up | Producer’s accuracy |
| Agriculture | 83.33 | 0.67 | 0.07 | 0.00 | 99.12 | |
| Woodland | 0.00 | 87.33 | 0.21 | 19.35 | 81.72 | |
| Bare land | 16.67 | 4.67 | 99.49 | 16.13 | 72.63 | |
| Build up | 0.00 | 7.33 | 0.24 | 64.52 | 89.51 | |
| User’s accuracy | 83.33 | 87.33 | 99.48 | 64.52 | ||
| OA = 83.66; KI = 0.82 | ||||||
| 2000 | Classes | Agriculture | Woodland | Bare land | Built-up | Producer’s accuracy |
| Agriculture | 88.24 | 2.40 | 0.11 | 14.29 | 84.01 | |
| Woodland | 0.00 | 91.62 | 0.17 | 7.14 | 92.62 | |
| Bare land | 11.76 | 4.79 | 99.49 | 14.29 | 76.33 | |
| Build up | 0.00 | 1.20 | 0.23 | 64.29 | 97.82 | |
| User’s accuracy | 88.24 | 91.61 | 99.49 | 64.28 | ||
| OA = 85.90; KI = 0.86 | ||||||
| 2005 | Classes | Agriculture | Woodland | Bare land | Built-up | Producer’s accuracy |
| Agriculture | 93.75 | 2.08 | 0.00 | 0.00 | 97.83 | |
| Woodland | 6.25 | 97.92 | 0.00 | 0.00 | 94.00 | |
| Bare land | 0.00 | 0.00 | 99.73 | 8.33 | 92.30 | |
| Build up | 0.00 | 0.00 | 0.27 | 91.67 | 99.71 | |
| User’s accuracy | 93.75 | 97.92 | 99.73 | 91.67 | ||
| OA = 95.77; KI = 0.90 | ||||||
| 2010 | Classes | Agriculture | Woodland | Bare land | Built-up | Producer’s accuracy |
| Agriculture | 93.55 | 9.23 | 0.00 | 0.00 | 91.00 | |
| Woodland | 6.45 | 90.77 | 0.00 | 0.00 | 93.37 | |
| Bare land | 0.00 | 0.00 | 99.93 | 9.38 | 91.37 | |
| Build up | 0.00 | 0.00 | 0.07 | 90.63 | 99.92 | |
| User’s accuracy | 93.55 | 90.77 | 99.93 | 90.62 | ||
| OA = 93.72; KI = 0.93 | ||||||
| 2015 | Classes | Agriculture | Woodland | Bare land | Built-up | Producer’s accuracy |
| Agriculture | 91.67 | 4.29 | 0.02 | 0 | 95.51 | |
| Woodland | 8.33 | 95.24 | 0 | 0 | 91.96 | |
| Bare land | 0 | 0.48 | 99.89 | 8.33 | 91.92 | |
| Build up | 0 | 0 | 0.09 | 91.67 | 99.90 | |
| User’s accuracy | 91.67 | 95.24 | 99.89 | 91.67 | ||
| OA = 95.62; KI = 0.95 | ||||||
| 2020 | Classes | Agriculture | Woodland | Bare land | Built-up | Producer’s accuracy |
| Agriculture | 92.86 | 0.69 | 0 | 0 | 99.26 | |
| Woodland | 7.14 | 99.04 | 0.01 | 0 | 93.27 | |
| Bare land | 0 | 0 | 99.93 | 0.62 | 99.38 | |
| Build up | 0 | 0 | 0.07 | 99.38 | 99.93 | |
| User’s accuracy | 92.86 | 99.31 | 99.92 | 99.38 | ||
| OA = 97.87; KI = 0.96 | ||||||
| LULC: land use/land cover; GIAHS: Globally Important Agricultural Heritage System. | ||||||
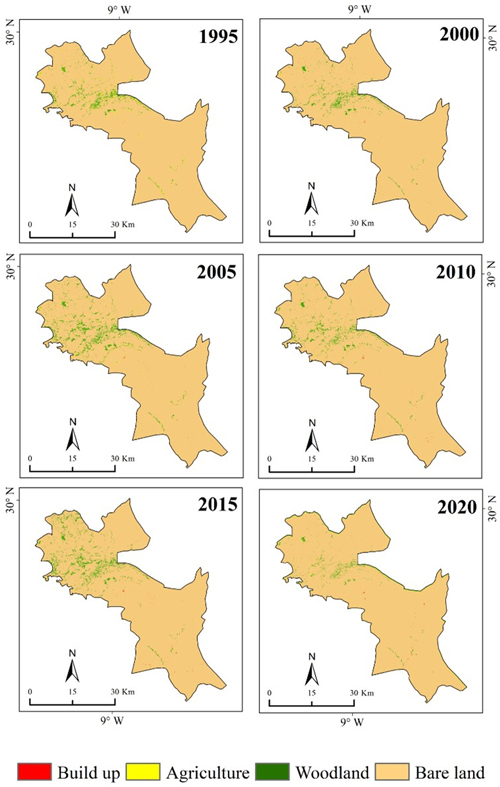
Fig. 8. Spatio-temporal change of LULC over the period 1995–2020 within the Globally Important Agricultural Heritage System (GIAHS) site.
| Table 3. Temporal variability in LULC Composition across Different Classes: 1995–2020. | ||||||
| Classes | 1995 (%) | 2000 (%) | 2005 (%) | 2010 (%) | 2015 (%) | 2020 (%) |
| Bare land | 97.268 | 98.123 | 96.562 | 97.869 | 96.783 | 98.429 |
| Woodland | 1.902 | 1.789 | 3.082 | 1.995 | 3.149 | 1.079 |
| Built-up | 0.002 | 0.018 | 0.009 | 0.026 | 0.045 | 0.055 |
| Agriculture | 0.828 | 0.070 | 0.347 | 0.111 | 0.022 | 0.436 |
| LULC: land use land cover (LULC). | ||||||
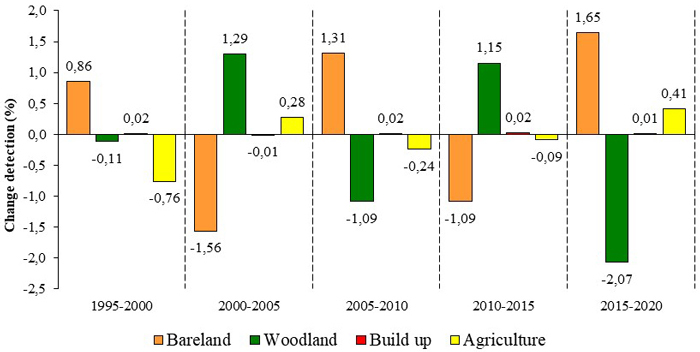
Fig. 9. Area based change detection of LCLU in respective periods.
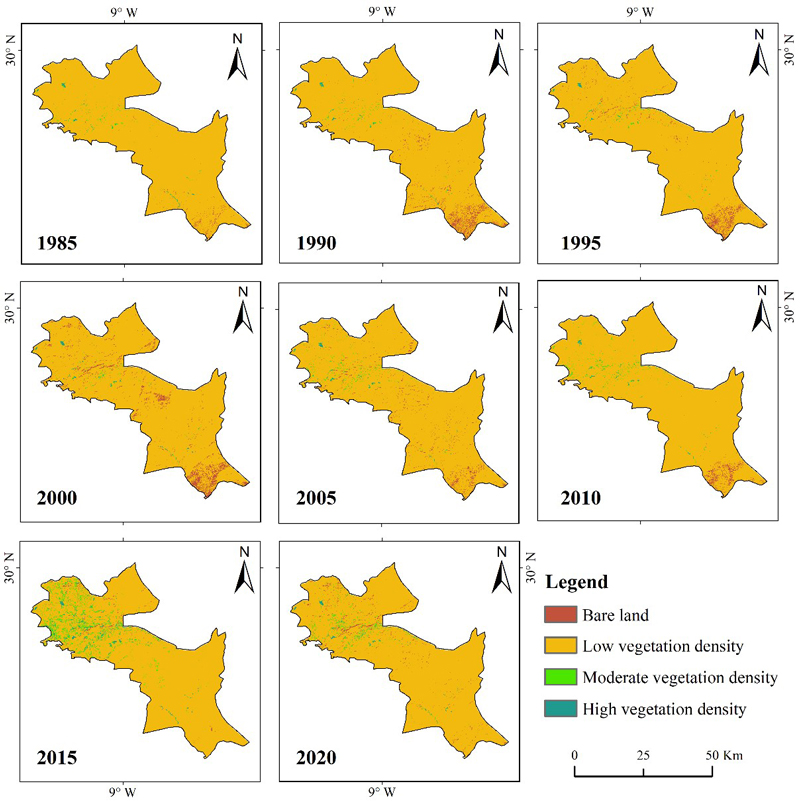
Fig. 10. Spatial patterns of NDVI rate of change in the Globally Important Agricultural Heritage System (GIAHS) site from 2000 to 2020.
| Table 4. Percentage temporal variation of vegetation density classes: 1985–2020. | ||||||||
| NDVI class | 1985 | 1990 | 1995 | 2000 | 2005 | 2010 | 2015 | 2020 |
| BL | 0.63 | 2.76 | 2.55 | 2.55 | 2.16 | 1.22 | 0.68 | 1.57 |
| LVD | 98.57 | 96.65 | 96.78 | 94.72 | 96.50 | 97.38 | 92.8 | 96.38 |
| MVD | 0.55 | 0.39 | 0.45 | 0.45 | 0.98 | 1.1 | 5.22 | 1.52 |
| HVD | 0.25 | 0.20 | 0.22 | 0.30 | 0.36 | 0.30 | 1.30 | 0.53 |
| BL, LDV, MVD, and HDV are acronyms for Bare Land, Low Vegetation Density, Moderate Vegetation Density, and High Vegetation Density, respectively. | ||||||||
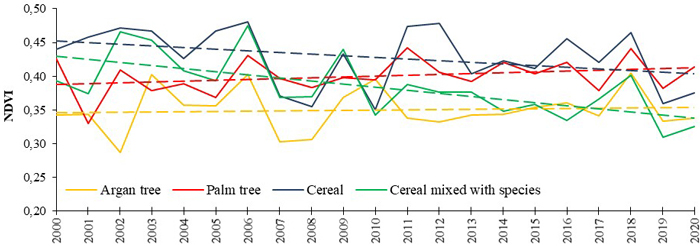
Fig. 11. Annual NDVI trends among various crop types from 2000 to 2020. Cereal mixed with species cereals are cultivated together with other crops, such as legumes, maize and alfalfa (Medicago sativa).
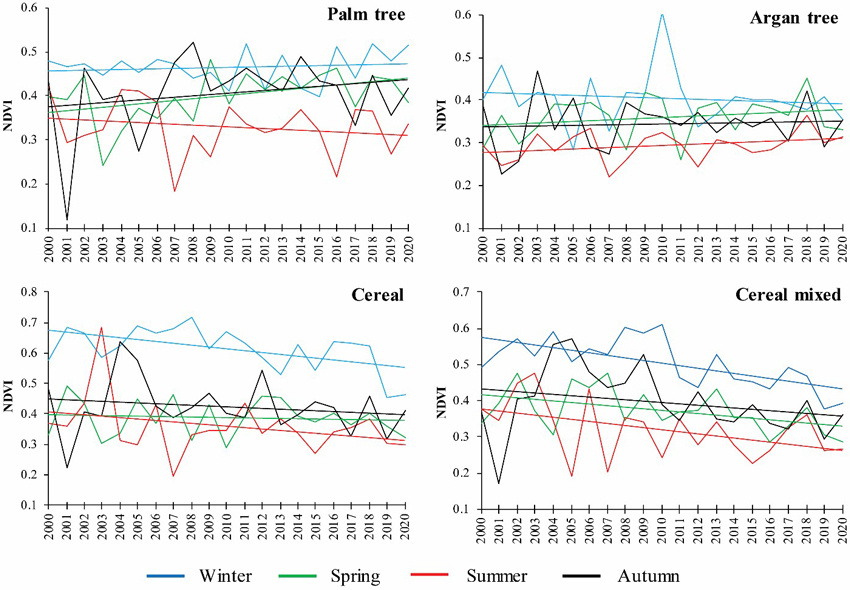
Fig. 12. Seasonal NDVI trends among various crop types from 2000 to 2020.
| Table 5. Mann-Kendall trend and Sen’s slope of remote sensing and drought index. | ||||||
| Variables | NDVI | SPEI-6 | SPEI-12 | |||
| Palm tree | Argan tree | Cereal | Cereal mixed with species | |||
| Z-score | 1.11 | 0.09 | –1.42 | –2.99* | –3.95* | –4.52* |
| Sen’s slope | 0.001 | 0.006 | –0.002 | –0.004 | –0.001 | –0.001 |
| Tau | 0.18 | 0.02 | –0.23 | –0.48 | –0.12 | –1.43 |
| Variance | 1096.6 | 1096.6 | 1096.6 | 1096.6 | 10158610 | 10158460 |
| * Significant p-value at 99% confidence level; SPEI-6: Standardized Precipitation Evapotranspiration Index at 6 months; SPEI-12: Standardized Precipitation Evapotranspiration Index at 12 months. | ||||||
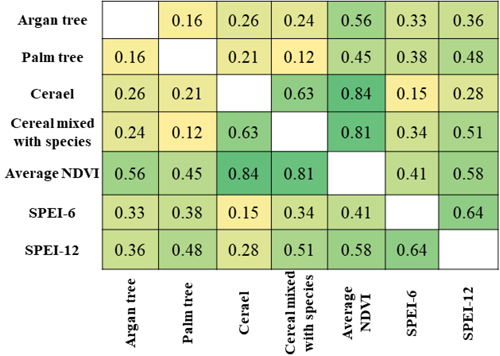
Fig. 13. Pearson correlation coefficient matrix of drought indicators. Cereal mixed with species (cereals are cultivated together with other crops, such as legumes, maize and alfalfa (Medicago sativa)). SPEI-6: Standardized Precipitation Evapotranspiration Index at 6 months; SPEI-12: Standardized Precipitation Evapotranspiration Index at 12 months.
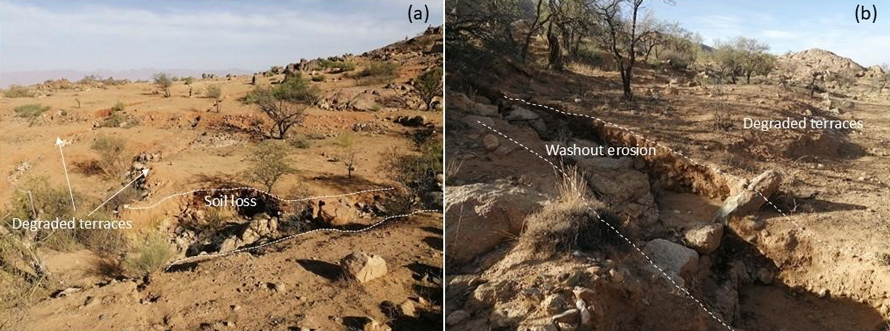
Fig. 14. Illustration of the impact of abandon on terraces: (a) soil loss and degraded terraces (b) Water erosion in the Southeast of the GIAHS. Credit: Moussa Ait El Kadi.
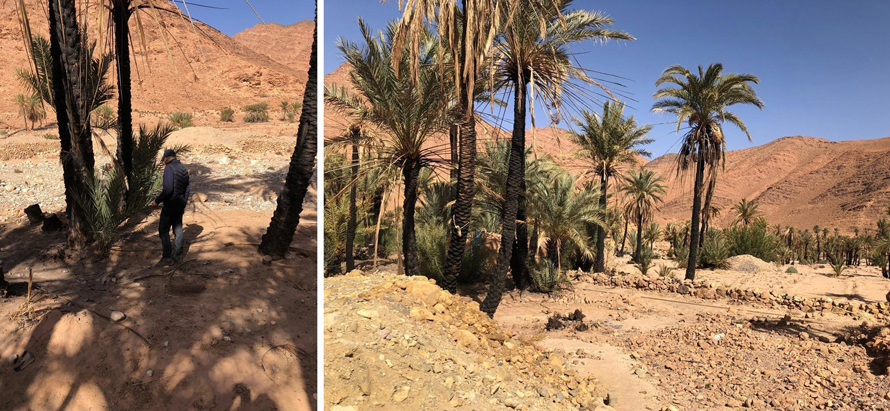
Fig. 15. Palm trees threatened by fire in Ait Mansour Oasis. Credit: Brahim Meskour.