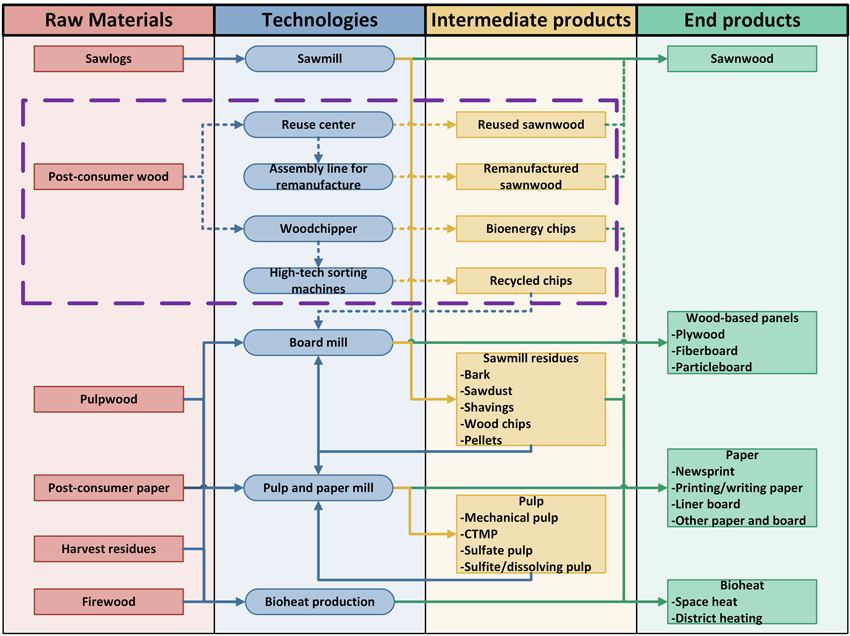
Fig. 1. The NFSM flow diagram illustrates how the model connects industrial technology with raw materials and production of intermediate and end products. The red dashed frame marks the current model extension for reutilization of post-consumer wood.
| Table 1. Generated and exported amounts of post-consumer wood by country/region. | ||||
| Country/Region | Population | Post-consumer wood | ||
| Capita* | Generated** | Net exports** | Per capita*** | |
| Baltics | 6 054 032 | 519 512 m3 | 0 m3 | 35 kg |
| Denmark | 5 840 045 | 390 244 m3 | –53 974 m3 | 27 kg |
| Finland | 5 548 241 | 1 345 580 m3 | –434 338 m3 | 99 kg |
| Norway | 5 391 369 | 1 917 073 m3 | 1 142 732 m3 | 146 kg |
| Sweden | 10 452 326 | 2 736 756 m3 | –1 168 065 m3 | 107 kg |
| * Sources: Statistics Estonia (2024), Official Statistics Portal (2024a), Official Statistics Portal (2024b), Statistics Denmark (2024), Statistics Finland (2024), Statistics Norway (2024a), Statistics Sweden (2022) ** Sources: FAO (2025), Statistics Norway (2024c). Converted from tonnes (Mg) to cubic meters (m3) per a conversion factor of 0.41–1 in accordance with Belbo and Gjølsjø (2008). Net exports as specified in the baseline scenario (0) *** Generated quantities by capita converted to kilograms (kg) | ||||
| Table 2. Compilation of various analyses of post-consumer wood. | |||
| Post-consumer wood fraction | SirkTRE – Norway, Gedde et al. (2025)* | InFutUReWood – the United Kingdom, Harte et al. (2020) | EcoReFibre – unspecified, Europe, Irle et al. (2023) |
| Solid wood | 29% wood packaging 26% untreated 13% treated | 27%** packaging waste 31% clean wood 42% treated wood | 59% solid wood |
| Wood-based panels | 7% untreated 13% treated | 12% chipboard 6% MDF 7% plywood 3% OSB | 33% panel products 4% fiberboard |
| Furniture, etc. | 6% furniture and doors | 3%** community wood recycling | |
| Contaminated and misplaced | 5% contaminated and misplaced 1% non-wood | 4% non-wood | |
| * Scaled by sectors based on Statistics Norway (2024c) ** Double-counting due to a) 27 percent of post-consumer wood originates from packaging waste, and b) 3 percent of post-consumer wood is redistributed through community wood recycling as furniture etc. | |||
| Table 3. Claims and own assumptions about the technical options for reutilization of post-consumer wood listed with associated sources. | |
| Claims | Associated sources |
| Policy instruments that stimulate value chains that collect, repair, and redistribute obsolete wooden pallets and cable drums can unleash a great potential for reuse and remanufacture. | (Gedde et al. 2025) |
| Whole lengths of structural wood can be dismantled and reused. | (Sakaguchi et al. 2016; Whittaker et al. 2021) (Harte et al. 2020; Llana et al. 2020) |
| A lack of automated grading standards for reused structural wood has been identified as a limiting factor. | (Husgafvel et al. 2018; Harte et al. 2020) |
| A pioneering Norwegian standard for visual grading has recently been published. | (Standard Norge 2025) |
| Structural wood could be planed, sanded, sliced, and utilized for cross-laminated timber (CLT). | (Irle et al. 2015; Irle et al. 2019; Harte et al. 2020) |
| Strength testing experiments have investigated the limits of reuse. | (Llana et al. 2022; Carrasco et al. 2023; Dong et al. 2024) |
| Finger-jointed post-consumer sawnwood could potentially achieve strength classes of C18 and C24, approved for general construction, but this requires careful pre-sorting and laborious work to remove metal. | (Stolze et al. 2023) |
| Sorting machines, connecting high-speed assembly lines and advanced sensor technology can effectively reject impurities, clean, dry, and sort chipped post-consumer wood by species and qualities. | (Mancini et al. 2018; Friedrich et al. 2022; Lima et al. 2022; Irle et al. 2023; Konstantinidis et al. 2023; Mancini et al. 2024) |
| If allocated to the core layer of a particleboard, at least up to 50 percent of the fresh wood chips could be replaced with recycled chips, which is also reflected in current practice in Europe. | (Azambuja et al. 2018; Faraca et al. 2019a; Döring et al. 2021; Niemz and Sandberg 2022; Nguyen et al. 2023) |
| Technology able to recycle and reutilize wood fibers for medium-density fiberboard (MDF) is available. | (Lubis et al. 2018; Hong et al. 2020) |
| MDF constitutes less than a tenth of both consumed wood products and generated post-consumer wood in the Nordic-Baltic area. | (FAO 2025) |
| The model may be adjusted with respect to two pragmatic simplifications not expected to significantly affect the results: • Recycling of MDF fibers has a modest impact on Nordic-Baltic reutilization and can thus be omitted. • Reused and remanufactured pallets, cable drums, etc. can be included in the existing product categories for reused and remanufactured sawnwood. | Own assumptions |
| Table 4. Connections between technologies, compliant post-consumer wood quality fractions, processes, second-life products, and applicable use. | ||||
| Technology | Compliant quality fractions | Processes | second-life product | Applicable use |
| Reuse center | Reusable | Cleaning, heating, repairing, removing fasteners. | Reused sawnwood (R3) | Same as fresh sawnwood |
| Assembly line for remanufacture | Remanufacturable | Screening, cutting, finger-jointing, planing. | Remanufactured sawnwood (R6) | Same as fresh sawnwood |
| High-tech sorting machines | Reusable Remanufacturable Recyclable | Sorting and cleaning pre-chipped post-consumer wood | Recycled chips (R8) | Core layer of particleboards (max 50%) |
| Woodchipper | Reusable Remanufacturable Recyclable Incinerable | Chipping of unsorted post-consumer wood | Bioenergy chips (R9) | Bioenergy (local heat, district heat, and combined heat and power (CHP)) |
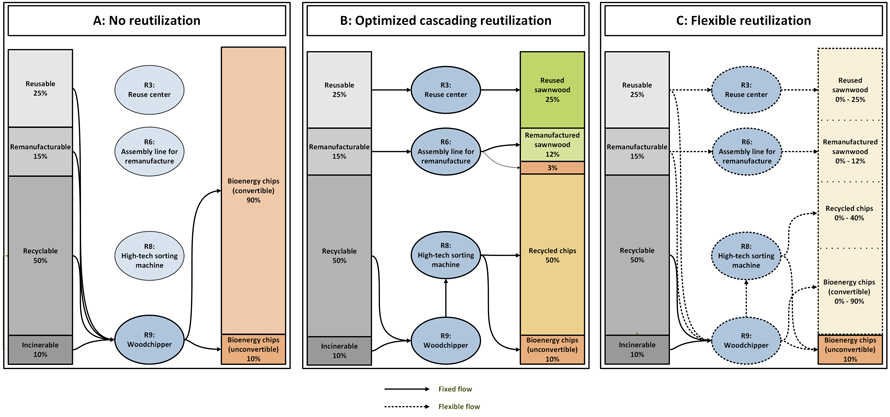
Fig. 2. The flow diagrams illustrate the modeled alternative pathways for reutilization of post-consumer wood. Illustration A shows a corner solution corresponding to the baseline scenario (0), where all quality fractions are chipped and used as bioenergy chips. Illustration B shows the opposite corner solution where a region reutilizes all quality fractions in optimized cascading order, in accordance with the hierarchy of the R Framework. Illustration C shows the model’s flexibility to reutilize some fractions, or parts of each fraction, at its highest level of quality, and the rest at lower levels. All intermediate solutions are available, which gives the model flexibility for unique allocations for each region based on welfare maximization. View larger in new window/tab.
| Table 5. Assigned policy codes related to given reutilization levels and policy alternatives. | ||
| Policy codes | Reutilization level (%) | Policy alternatives |
| 0 | 0 | Baseline |
| U30 | 30 | Unilateral (Norway) |
| U50 | 50 | |
| U70 | 70 | |
| M30 | 30 | Multilateral (Nordic-Baltic countries) |
| M50 | 50 | |
| M70 | 70 | |
| Table 6. Produced volumes in thousands of solid cubic meters (bioenergy output is given in GWh) and percentage change relative to the baseline scenario (0) in parentheses. | |||||||
| Norway | |||||||
| 0 | U30 | U50 | U70 | M30 | M50 | M70 | |
| Post-consumer wood | 1917 | 1917 - | 1917 - | 1917 - | 1917 - | 1917 - | 1917 - |
| Sawlogs | 6782 | 6739 (–0.6%) | 6739 (–0.6%) | 6719 (–0.9%) | 6570 (–3.1%) | 6469 (–4.6%) | 6430 (–5.2%) |
| Pulpwood | 6971 | 6987 (0.2%) | 6986 (0.2%) | 6994 (0.3%) | 6996 (0.4%) | 6998 (0.4%) | 7015 (0.6%) |
| Harvest residues | 0 | 0 - | 0 - | 0 - | 0 - | 0 - | 0 - |
| Dust | 308 | 308 (0.0%) | 308 (0.0%) | 308 (0.0%) | 310 (0.7%) | 308 (0.0%) | 308 (0.0%) |
| Bark | 1679 | 1675 (–0.2%) | 1656 (–1.4%) | 1678 (–0.1%) | 1637 (–2.5%) | 1569 (–6.6%) | 1616 (–3.8%) |
| Shavings | 17 | 17 (–0.2%) | 16 (–2.5%) | 17 (–0.2%) | 16 (–5.5%) | 15 (–12.3%) | 17 (1.2%) |
| Pellets | 87 | 87 (–0.4%) | 49 (–44.4%) | 87 (–0.6%) | 87 (0.0%) | 49 (–44.4%) | 49 (–44.4%) |
| Fresh wood chips | 1266 | 1272 (0.5%) | 1273 (0.6%) | 1273 (0.6%) | 1268 (0.2%) | 1270 (0.4%) | 1273 (0.6%) |
| Recycled chips | 0 | 452 - | 684 - | 1041 - | 505 - | 765 - | 786 - |
| Bioenergy chips | 774 | 709 (–8.4%) | 571 (–26.3%) | 607 (–21.6%) | 762 (–1.6%) | 1054 (36.2%) | 709 (–8.4%) |
| Bioenergy (GWh) | 7 | 7 - | 7 - | 7 - | 7 - | 7 - | 7 - |
| Fresh sawnwood | 3311 | 3305 (–0.2%) | 3296 (–0.4%) | 3306 (–0.1%) | 3171 (–3.9%) | 2999 (–9.4%) | 3168 (–4.3%) |
| Reused sawnwood | 0 | 65 - | 132 - | 163 - | 13 - | 97 - | 358 - |
| Remanufactured sawnwood | 0 | 0 - | 47 - | 4 - | 0 - | 0 - | 64 - |
| Particleboards | 405 | 405 (0.0%) | 445 (9.7%) | 405 (0.0%) | 418 (3.1%) | 405 (0.0%) | 464 (14.6%) |
| Plywood | 0 | 0 (0.0%) | 0 (0.0%) | 0 (0.0%) | 0 (0.0%) | 0 (0.0%) | 0 (0.0%) |
| Fiberboards | 170 | 170 (0.0%) | 170 (0.0%) | 170 (0.0%) | 170 (0.0%) | 170 (0.0%) | 170 (0.0%) |
| Nordics/Baltics | |||||||
| 0 | U30 | U50 | U70 | M30 | M50 | M70 | |
| Post-consumer wood | 6909 | 6909 - | 6909 - | 6909 - | 6909 - | 6909 - | 6909 - |
| Sawlogs | 84 921 | 84 630 (–0.3%) | 84 700 (–0.3%) | 84 529 (–0.5%) | 83 662 (–1.5%) | 82 898 (–2.4%) | 81 511 (–4.0%) |
| Pulpwood | 122 804 | 122 891 (0.1%) | 122 859 (0.0%) | 122 865 (0.1%) | 123 153 (0.3%) | 123 153 (0.3%) | 122 800 (0.0%) |
| Harvest residues | 14 021 | 14 763 (5.3%) | 14 806 (5.6%) | 15 500 (10.5%) | 16 397 (16.9%) | 17 320 (23.5%) | 18 208 (29.9%) |
| Dust | 11 350 | 11 310 (–0.4%) | 11 320 (–0.3%) | 11 295 (–0.5%) | 11 185 (–1.5%) | 11 090 (–2.3%) | 10 884 (–4.1%) |
| Bark | 30 186 | 30 140 (–0.2%) | 30 130 (–0.2%) | 30 113 (–0.2%) | 29 985 (–0.7%) | 29 802 (–1.3%) | 29 477 (–2.3%) |
| Shavings | 3000 | 2989 (–0.4%) | 2992 (–0.3%) | 2984 (–0.5%) | 2958 (–1.4%) | 2938 (–2.1%) | 2872 (–4.3%) |
| Pellets | 6919 | 6919 (0.0%) | 6880 (–0.6%) | 6936 (0.2%) | 6913 (–0.1%) | 6877 (–0.6%) | 6871 (–0.7%) |
| Fresh wood chips | 40 616 | 40 623 (0.0%) | 40 623 (0.0%) | 40 623 (0.0%) | 40 618 (0.0%) | 40 621 (0.0%) | 40 623 (0.0%) |
| Recycled chips | 0 | 452 - | 684 - | 1041 - | 1266 - | 1950 - | 2511 - |
| Bioenergy chips | 7360 | 6694 (–9.1%) | 6501 (–11.7%) | 6004 (–18.4%) | 5212 (–29.2%) | 4057 (–44.9%) | 2710 (–63.2%) |
| Bioenergy (GWh) | 116 | 116 - | 116 - | 116 - | 116 - | 116 - | 116 - |
| Reused sawnwood | 1 | 206 - | 133 - | 303 - | 874 - | 1181 - | 1544 - |
| Remanufactured sawnwood | 61 | 71 - | 105 - | 75 - | 72 - | 234 - | 657 - |
| Fresh sawnwood | 43 653 | 43 495 (–0.4%) | 43 532 (–0.3%) | 43 441 (–0.5%) | 42 959 (–1.6%) | 42 530 (–2.6%) | 41 797 (–4.3%) |
| Particleboards | 3363 | 3782 (12.5%) | 3966 (18.0%) | 3916 (16.5%) | 4056 (20.6%) | 4189 (24.6%) | 4142 (23.2%) |
| Plywood | 1831 | 1831 (0.0%) | 1831 (0.0%) | 1831 (0.0%) | 1831 (0.0%) | 1831 (0.0%) | 1831 (0.0%) |
| Fiberboards | 366 | 366 (0.0%) | 366 (0.0%) | 366 (0.0%) | 366 (0.0%) | 366 (0.0%) | 366 (0.0%) |
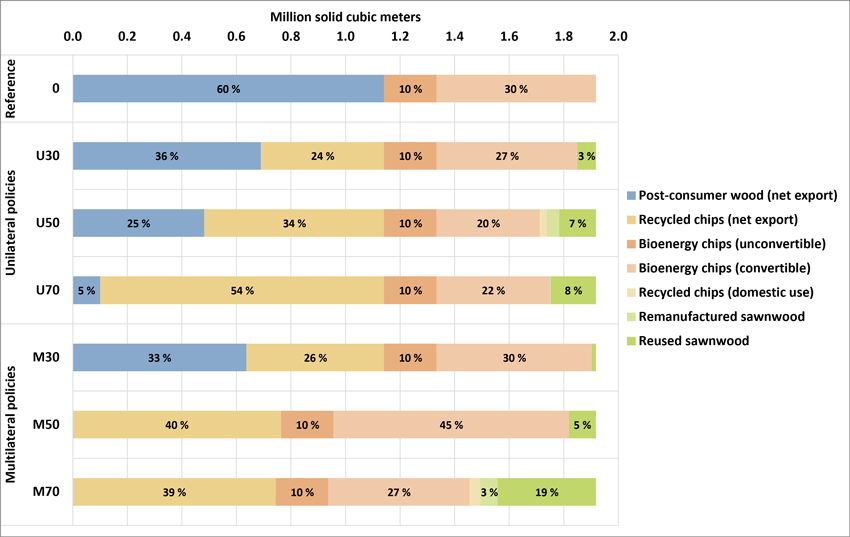
Fig. 3. The stacked bars illustrate the distribution of the aggregate end-use of post-consumer wood in Norway for the different scenarios, displayed in millions of solid cubic meters and percentage of total.
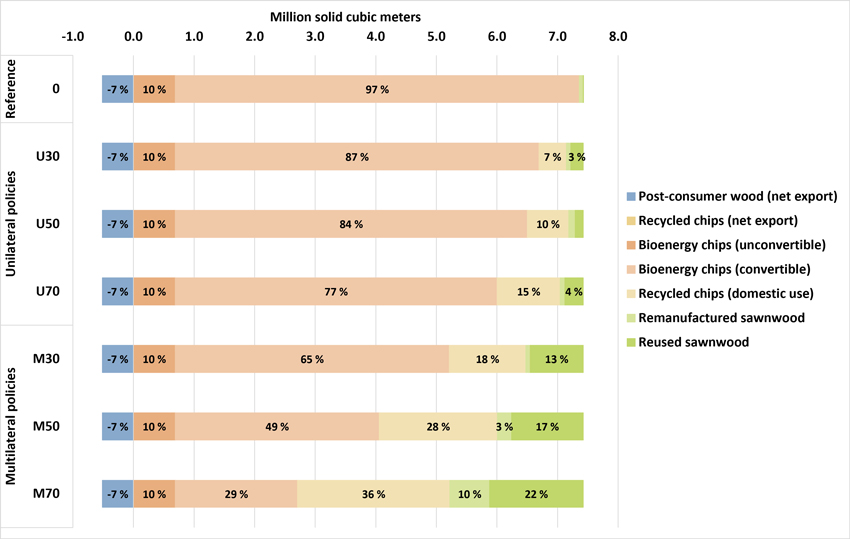
Fig. 4. The stacked bars illustrate the distribution of the aggregate end-use of post-consumer wood in the Nordic-Baltic countries for the different scenarios, displayed in millions of solid cubic meters and percentage of total.
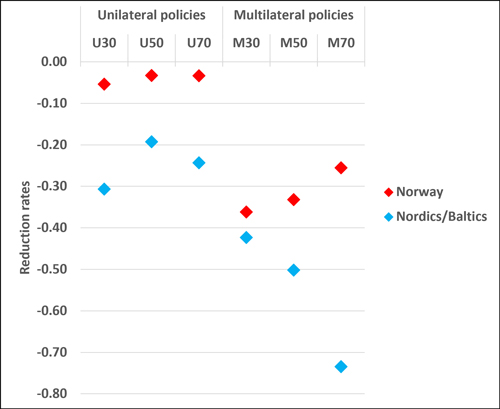
Fig. 5. The chart shows the relative reduction in logging compared to the baseline scenario (0). The reduction rate specifies the number of cubic meters of reduced roundwood harvest per cubic meter of reutilized post-consumer wood for each scenario, for Norway and the Nordic-Baltic area (including Norway), respectively.