| Table 1. Calculation of displacement factors (DF). The total substitution impact reported by Hurmekoski et al. (2023) for Finland in 2020 was distributed among the product categories used in Maanavilja et al. (2021). The production values in those categories (Maanavilja et al. 2021) for 2020 were used to calculate the DFs. “Decarbonized” DFs (DDF) were calculated by assuming a 2.17% annual average rate of decrease (Hurmekoski et al. 2023). A carbon content assumption of 50% from dry fiber content was used for all categories. | |||||||||||
| Product categories for the analysis | Displacement factors (DF) for this analysis (tC tC–1) | ||||||||||
| Low (Hurmekoski et al. 2023) | High (Skytt et al. 2021) | ||||||||||
| Product category | FAO Item code | Unit | Dry fiber content | Product categories in original reference | 2020 DF | DDF in 2025 | DDF in 2030 | DDF in 2035 | DDF in 2040 | Product categories in original reference | 2020 DF |
| Energy | 1864 (all geographic levels) | m3 × 106 | 500 kg m–3 | Energywood, solid residues | 0.21 | 0.18 | 0.15 | 0.12 | 0.10 | Energy | 0.35 |
| Forest chips, forest industry byproducts and fuelwood (Finland only, according to Maanavilja et al. (2021) | |||||||||||
| Pulp used for packaging | 1875 Allocated by proportion of all paper (1876) and dissolving pulp (1667) that is used for packaging paper (2043) | t × 106 | 900 kg t–1 | 20% of Chemical pulp, 25% of mechanical pulp | 0.09 | 0.08 | 0.07 | 0.07 | 0.06 | Packaging paper | 1.5 |
| Pulp not used for packaging | t × 106 | 900 kg t–1 | All pulp and paper categories (including dissolving pulp and pulp waste), less fraction to paperboard | 0.03 | 0.03 | 0.03 | 0.03 | 0.02 | Pulp and paper, other than packaging paper | 0.5 | |
| Sawn timber | 1872 | m3 × 106 | 500 kg m–3 | Coniferous and non-coniferous sawn timber | 0.96 | 0.86 | 0.76 | 0.65 | 0.55 | Sawn products, other than glued laminated timber | 1.43 |
| Wood-based panels | 1873 | m3 × 106 | 500 kg m–3 | Plywood, OSB, particle board, fiberboards | 0.49 | 0.43 | 0.38 | 0.33 | 0.28 | Glued laminated timber | 1.27 |
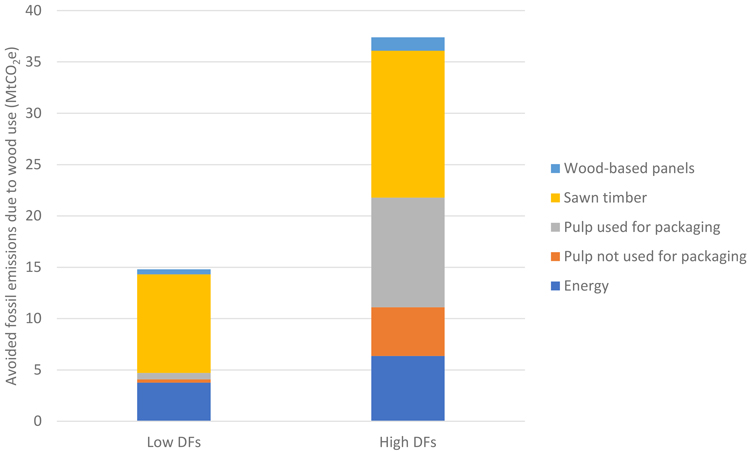
Fig. 1. Contribution of each product category to the total avoided annual fossil carbon emissions by Finnish wood products and energy in 2020, comparing different displacement factor (DF) assumptions (for components included in categories, see Table 1).
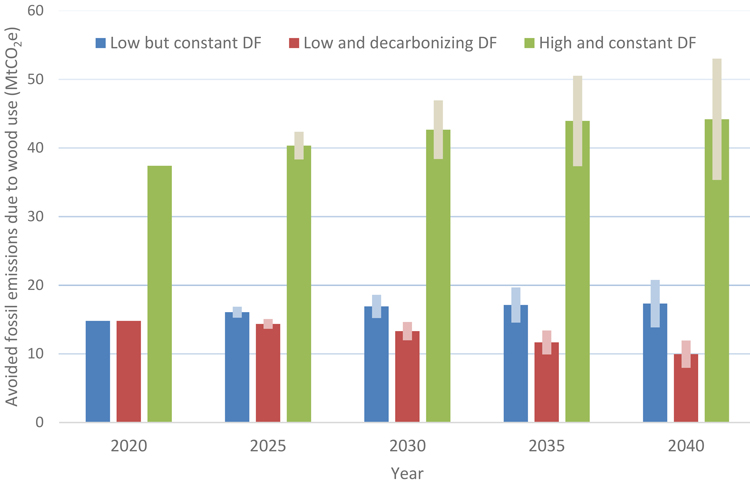
Fig. 2. Total substitution impact (avoided fossil carbon emissions due to wood use) of Finnish wood products with varying future production levels (error bars: low end referring to –20% harvest volume, high end referring to +20% harvest volume compared to Maanavilja et al. (2021)), using three displacement factor (DF) sets: Low (Hurmekoski et al. 2023) with and without decarbonization, and High (Skytt et al. (2021), (Table 1).
| Table 2. Avoided fossil emissions due to wood use in Finland, the European Union (EU), and the world in 2020, estimated using Low or High displacement factor (DF) sets, and total reported LULUCF and fossil emissions data. | |||||||
| Region Population 2020 (databank.worldbank.org) | Finland 5 529 543 | EU 446 870 959 | World 7 854 748 424 | ||||
| Avoided fossil emissions from wood use calculated for 2020 | DF set* | Low | High | Low | High | Low | High |
| Wood product type | |||||||
| Energy (MtCO2e) | 1.7 (3.8)** | 2.9 (6.4)** | 22.8 | 38.5 | 367.1 | 619.8 | |
| Pulp for packaging (MtCO2e) | 0.6 | 11.2 | 3.1 | 53.6 | 16.5 | 285.2 | |
| Pulp not used for packaging (MtCO2e) | 0.3 | 5.0 | 0.9 | 13.0 | 4.1 | 60.2 | |
| Sawn timber (MtCO2e) | 9.7 | 14.4 | 96.8 | 144.3 | 422.6 | 629.8 | |
| Wood-based panels (MtCO2e) | 0.5 | 1.3 | 25.8 | 67.6 | 160.4 | 419.5 | |
| Total | 12.9 (14.9)** | 34.7 (38.2)** | 149 | 317 | 971 | 2014 | |
| Per capita (tCO2e) | 2.33 (2.69) | 6.28 (6.91) | 0.33 | 0.71 | 0.12 | 0.26 | |
| Other sinks or sources reported for 2020 | Land use, land use change, and forestry (LULUCF) (MtCO2e) | 9.1*** | 241*** | 4301**** | |||
| Total fossil emissions (MtCO2e)***** | 40.7 | 2622 | 35 963 | ||||
| * Displacement factors adapted from Hurmekoski et al. (2023; “Low”) and Skytt et al. (2021; “High”) (Table 1). ** (Values in parentheses) include forestry and wood industry processing residues used for energy. Such values are not available for the EU and world. See Table 1. *** Eurostat (2024) **** Calculation based on data from Friedlingstein et al. (2023) ***** Crippa et al. (2021) | |||||||
| Table 3. Cumulative substitution impact of wood harvested (i.e., fossil carbon emissions avoided) from 2000–2020 calculated using Low (Hurmekoski et al. 2023) and High (Skytt et al. 2021) displacement factor (DF) sets for wood products in Finland, the European Union (EU), and the world. | |||||
| Substitution intensity of harvest in 2020 (tCO2 m–3) | Cumulative harvest 2000–2020 (m3) | Cumulative substitution impact (MtCO2e) 2000–2020 | |||
| Low DF’s | High DF’s | Low DF’s | High DF’s | ||
| Finland | 0.21 | 0.58 | 1.17 × 10⁹ | 250 | 675 |
| EU | 0.31 | 0.65 | 9.41 × 10⁹ | 2900 | 6151 |
| World | 0.26 | 0.54 | 7.66 × 10¹⁰ | 19 828 | 41 149 |