| Table 1. Average share (%) of fuel from primary and secondary forest fuels, recycled wood, agricultural fuels and other fuels according to the facilities’ total purchased quantity of solid fuels (Fuel quantity) and geographies. Where there was a significant difference between the groups (p < 0.05), this is indicated by paired letters. South = Götaland, Other = Svealand + Norrland. | |||||||
| Category | Grouping | N | Primary forest fuels (%) | Secondary forest fuels (%) | Recycled wood (%) | Agricultural fuels (%) | Other fuels (%) |
| Fuel quantity | <15 GWh | 32 | 39.2 | 38.3 | 0.0a | 0.0 | 22.5 |
| 15–50 GWh | 24 | 52.2 | 40.6 | 2.1b | 0.3 | 4.9 | |
| >50 GWh | 31 | 49.2 | 19.9 | 20.5a,b | 0.2 | 9.8 | |
| Average | 46.4 | 32.4 | 7.9 | 0.1 | 13.1 | ||
| Geographic location | South | 60 | 41.5 | 35.5 | 5.6 | 0.0 | 17.2c |
| Other | 27 | 57.2 | 25.4 | 12.9 | 0.4 | 4.0c | |
| Average | 46.4 | 32.4 | 7.9 | 0.1 | 13.1 | ||
| Table 2. Proportion (%) of respondents per delivery period and storage time of the fuel. | ||||
| Storage time (weeks) | Time for delivery/production of comminuted fuels | |||
| January–March (n = 28) | April–June (n = 29) | July–September (n = 29) | October–December (n = 28) | |
| <2 | 57.1 | 13.8 | 3.4 | 32.1 |
| 2–4 | 32.1 | 37.9 | 10.3 | 46.4 |
| 5–12 | 7.1 | 20.7 | 62.1 | 17.9 |
| >12 | 3.6 | 27.6 | 24.1 | 3.6 |
| Table 3. Proportion of respondents (%) who perform various types of quality determinations of comminuted fuels upon delivery, during storage or when about to be combusted. (n = 31). | |||||
| Category | Moisture content | Ash content | Particle size distribution | Energy content | |
| Systematic sampling and analysis in the lab according to accepted methods is done… | …at delivery | 71.0 | 25.8 | 12.9 | 45.2 |
| …during storage | 0.0 | 6.5 | 6.5 | 6.5 | |
| …close to combustion | 3.2 | 9.7 | 0.0 | 9.7 | |
| …not at all | 25.8 | 58.1 | 83.9 | 38.7 | |
| Arbitrary sampling and analysis in the lab according to accepted methods is done… | … at delivery | 9.7 | 12.9 | 6.5 | 19.4 |
| … during storage | 0.0 | 3.2 | 3.2 | 0.0 | |
| … close to combustion | 6.5 | 6.5 | 3.2 | 6.5 | |
| … not at all | 87.1 | 77.4 | 93.5 | 74.2 | |
| Arbitrary sampling and subjective assessment are made… | … at delivery | 16.1 | 0.0 | 19.4 | 3.2 |
| … during storage | 0.0 | 0.0 | 0.0 | 0.0 | |
| … close to combustion | 3.2 | 3.2 | 3.2 | 0.0 | |
| … not at all | 80.6 | 96.8 | 77.4 | 96.8 | |
| Table 4. Proportion of respondents (%) who used the specified measurement methods to determine fuel quantity and fire risk during storage. (n = 30). | ||||
| Measurement method | Stacked volume | Temperature in the stack/fire risk | ||
| Comminuted fuels | Non-comminuted fuels | Comminuted fuels | Non-comminuted fuels | |
| Remote sensing with stationary sensors mounted on infrastructure | 3.3 | 0.0 | 10.0 | 0.0 |
| Remote sensing with sensors on drones | 33.3 | 10.0 | 3.3 | 0.0 |
| Manual measurement with analog measuring systems at stack | 23.3 | 16.7 | 23.3 | 0.0 |
| Manual measurement with digital non-contact systems at stack | 10.0 | 3.3 | 13.3 | 0.0 |
| Subjective estimation | 33.3 | 20.0 | 26.7 | 23.3 |
| None | 13.3 | 56.7 | 36.7 | 76.7 |
| Table 5. Percentage (%) of respondents whose stacks were within the specified size range regarding width, height and length (expressed in meters), and the shape of the top when storing comminuted and non-comminuted fuels at the production site and at the terminal. | |||||
| Properties | Comminuted fuels | Non-comminuted fuels | |||
| Production site (n = 25) | Terminal (n = 10) | Production site (n = 9) | Terminal (n = 8) | ||
| Width at the base (m) | ≤5 | 0.0 | 10.0 | 55.6 | 50.0 |
| 6–12 | 44.0 | 30.0 | 0.0 | 37.5 | |
| 13–20 | 40.0 | 40.0 | 22.2 | 0.0 | |
| >20 | 16.0 | 20.0 | 22.2 | 12.5 | |
| Height (m) | <5 | 32.0 | 40.0 | 44.4 | 37.5 |
| 5–6 | 52.0 | 40.0 | 33.3 | 62.5 | |
| 7–10 | 12.0 | 20.0 | 11.1 | 0.0 | |
| >10 | 4.0 | 0.0 | 11.1 | 0.0 | |
| Length (m) | <20 | 28.0 | 20.0 | 22.2 | 25.0 |
| 20–40 | 32.0 | 20.0 | 22.2 | 25.0 | |
| 41–60 | 16.0 | 20.0 | 22.2 | 0.0 | |
| >60 | 24.0 | 40.0 | 33.3 | 50.0 | |
| Shape of the top | Plane | 33.3 | 33.3 | 66.7 | 85.7 |
| Peaky | 66.7 | 66.7 | 33.3 | 14.3 | |
| Table 6. Division of labour and use of machines for different types of activities, expressed as a percentage (%) of respondents for each activity. | ||||||
| Operations | N | Mainly done by | Not carried out | |||
| Own personnel | Hired personnel | Contractors | ||||
| Own machines | Rented machines | Own machines | ||||
| Chipping | 30 | 0.0 | 0.0 | 6.7 | 70.0 | 23.3 |
| Crushing | 30 | 0.0 | 0.0 | 0.0 | 66.7 | 33.3 |
| Removal of coarse chipped/crushed fractions | 29 | 17.2 | 0.0 | 0.0 | 13.8 | 69.0 |
| Removal of chipped/crushed fine fractions | 29 | 0.0 | 3.4 | 0.0 | 13.8 | 82.8 |
| Removal of non-combustible material | 29 | 3.4 | 0.0 | 0.0 | 6.9 | 89.7 |
| Removal of metals in chipped/crushed material | 29 | 20.7 | 0.0 | 0.0 | 17.2 | 62.1 |
| Handling of chipped/crushed material with wheel loader | 29 | 51.7 | 0.0 | 10.3 | 27.6 | 10.3 |
| Handling of chipped/crushed material with a high loader | 28 | 7.1 | 0.0 | 0.0 | 21.4 | 71.4 |
| Construction of wood chip piles with a wheel loader equipped with a putter/plow blade that pushes the wood chips up | 28 | 37.9 | 3.4 | 6.9 | 20.7 | 31.0 |
| Moving chipped/crushed material with conveyor belt | 30 | 33.3 | 0.0 | 0.0 | 0.0 | 66.7 |
| Moving chipped/crushed material with a cart | 28 | 0.0 | 0.0 | 3.6 | 3.6 | 92.9 |
| Demolition of stack, e.g. in case of fire | 26 | 30.8 | 3.9 | 7.7 | 19.2 | 38.5 |
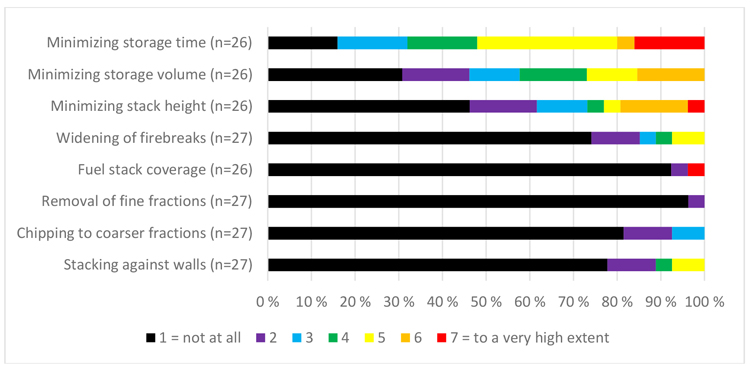
Fig. 1. Distribution of respondents according to the extent to which they take various measures to minimize storage losses, indicated on a scale of one to seven.
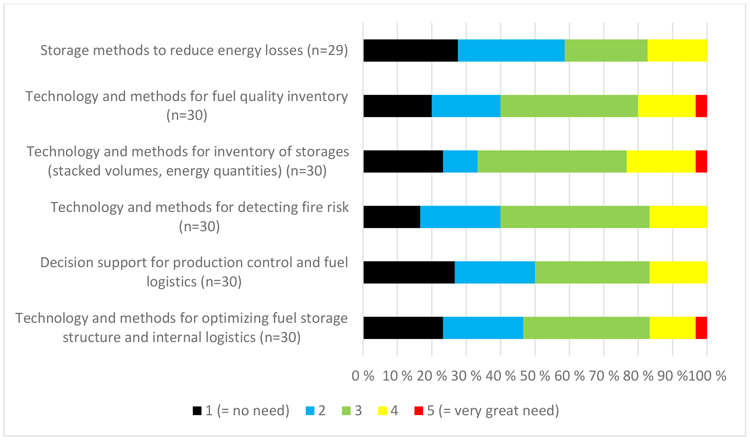
Fig. 2. Distribution of respondents based on how great development need they perceived existed, on a scale from one to five.
| Table 7. Intra- and inter correlation matrix of actions taken (no. 1–8, answering level 1–7, were 1 indicate no actions made and 7 actions made to very high extent) and perceived development need (no. 9–14, answering level 1–5, were 1 indicate no need and 5 very high need). Marked cells indicate expected correlations. Yellow cells indicate correlations ≥ ±0.2. Orange cells indicate significant correlations were, **indicate correlation at the 0.01 level (2-tailed) and * at the 0.05 level (2-tailed). | ||||||||||||||||||
| No. | Actions taken (1–9) and percieved development need (9–14) | Mean | SD | N | 1 | 2 | 3 | 4 | 5 | 6 | 7 | 8 | 9 | 10 | 11 | 12 | 13 | 14 |
| 1 | Minimizing storage time | 4.2 | 1.9 | 25 | 1 | |||||||||||||
| 2 | Min. storage volume | 3.1 | 1.9 | 26 | 0.61** | 1 | ||||||||||||
| 3 | Min. stack height | 2.7 | 2.1 | 26 | 0.44* | 0.55** | 1 | |||||||||||
| 4 | Widening of firebreaks | 1.6 | 1.2 | 27 | 0.16 | 0.15 | 0.44* | 1 | ||||||||||
| 5 | Fuel stack coverage | 1.3 | 1.2 | 26 | 0.08 | 0.22 | –0.07 | 0.07 | 1 | |||||||||
| 6 | Removal of fine fractions | 1.0 | 0.2 | 27 | –0.03 | 0.10 | –0.07 | 0.07 | 0.13 | 1 | ||||||||
| 7 | Chipping to coarser fractions | 1.3 | 0.6 | 27 | –0.02 | 0.09 | 0.18 | –0.17 | –0.05 | 0.25 | 1 | |||||||
| 8 | Stacking against concrete walls | 1.5 | 1.2 | 27 | 0.17 | –0.04 | 0.38 | 0.23 | –0.08 | 0.08 | –0.03 | 1 | ||||||
| 9 | Storage methods to reduce energy losses | 2.3 | 1.1 | 29 | 0.16 | 0.36 | –0.04 | –0.03 | –0.03 | 0.15 | 0.09 | 0.09 | 1 | |||||
| 10 | Technology och methods for fuel quality inventory | 2.6 | 1.1 | 30 | 0.50* | 0.26 | 0.09 | 0.03 | 0.07 | 0.06 | 0.09 | 0.12 | 0.42* | 1 | ||||
| 11 | Technology and methods for inventory of storages (stacked volumes, energy quantities) | 2.7 | 1.1 | 30 | 0.23 | 0.31 | 0.03 | 0.10 | 0.03 | 0.04 | 0.14 | 0.03 | 0.39* | 0.65** | 1 | |||
| 12 | Technology and methods for detecting fire risk | 2.6 | 1.0 | 30 | 0.18 | 0.06 | 0.04 | –0.20 | –0.14 | 0.08 | 0.11 | 0.17 | 0.56** | 0.54** | 0.63** | 1 | ||
| 13 | Decision support for production control and fuel logistics | 2.4 | 1.1 | 30 | 0.20 | 0.20 | –0.14 | 0.14 | –0.08 | 0.10 | 0.05 | –0.07 | 0.35 | 0.60** | 0.72** | 0.50** | 1 | |
| 14 | Technology and methods for optimizing fuel storage structure and internal logistics | 2.5 | 1.1 | 30 | 0.30 | 0.21 | –0.31 | –0.12 | –0.09 | 0.09 | 0.02 | –0.15 | 0.43* | 0.55** | 0.70** | 0.52** | 0.79** | 1 |
| Table 8. Gap analysis combining respondents ranking of actions taken to minimize storage losses and respondents ranking of perceived effectiveness of actions, deviations from expectations of correlations and theory. High Gaps indicate major gaps between theory and practice, Medium Gaps indicate that current practices struggle to meet both theory and perceived effectiveness of actions or perceived need of development, and Alignment indicate areas where theory, current practice and perceived needs of development or perceived effectiveness of actions, align well. | ||||||
| Actions taken | Rank | Percieved development needs | Gap | |||
| Actions taken | Perceived effectiveness of actions | Deviation from expectation | High | Medium | Align | |
| Minimizing storage time | 1 | 1 | Small | x | ||
| Minimizing storage volume | 2 | 2 | Medium | x | ||
| Minimizing stack height | 3 | 4 | Large | x | ||
| Widening of firebreaks | 4 | 8 | Large | x | ||
| Fuel stack coverage | 6 | 3 | XLarge | x | ||
| Removal of fine fractions | 8 | 6 | XLarge | x | ||
| Chipping to coarser fractions | 7 | 5 | XLarge | x | ||
| Stacking against concrete walls | 5 | 7 | XLarge | x | ||