| Table 1. Forest compartment-level inventory data for merchantable trees on the two harvest sites provided by the landowner. | ||||
| QMD a (cm) | Trees ha–1 | Basal area (m2 ha–1) | Tonnes ha–1 | |
| Compartment estimate | 18.2 | 1435 | 37.1 | 208 |
| a QMD = quadratic mean diameter. | ||||
| Table 2. Cycle definitions and variables recorded during the elemental time studies of the harvester and forwarder. | |||
| Machine | Functions | Cycle definition | Variables |
| Harvester | Felling and processing | Began when the last piece (i.e., log) of a processed tree was placed on the ground and ended when the last piece of the next tree was placed on the ground | Cycle time Delay time Pieces tree–1 Volume tree–1 (m3) Species |
| Forwarder | Primary transportation | Began when the empty forwarder exited the landing and ended when the forwarder completed unloading the next load and exited the landing | Cycle time Outhaul time Inhaul time Moving time Loading time Unloading time Delay time Forwarding distance Time spent at each stop Number of grapple loads at each stop Number of logs picked up at each stop |
| Loading | Began when the forwarder contacted the first log to be placed on the trailer and ended when the last log was placed on the trailer | Cycle time Delay time Time spent loading front trailer bay Time spent loading rear trailer bay Hot loading or cold loadinga Number of logs loaded | |
| a Hot loading refers to loading a trailer directly from the forwarder while cold loading refers to loading logs previously stacked on the landing. | |||
| Table 3. Machine rate assumptions (Black et al. 2025). | |||
| Variable | Machine | ||
| Harvester | Forwarder | Tracked loader | |
| Purchase price, USD | 800 000 | 749 000 | 382 000 |
| Salvage value, % of purchase price | 29 | 29 | 41 |
| Economic life, yr | 6 | 7 | 6 |
| Fuel consumption, l pmh–1 | 17.1 | 18.5 | 10.4 |
| Lubrication, USD yr–1 | 7300 | 6800 | 6000 |
| Maintenance and repair, USD yr–1 | 5500 | 4800 | 16 800 |
| Utilization, % | 69 | 77 | 71 |
| Availability a, % | 85 | 70 a | 80 |
| Scheduled machine hours (smh) yr–1 | 2000 | 2000 | 2000 |
| l pmh–1 = liters per productive machine hour (excluding delays). a Forwarder availability was increased to 85% when a tracked loader was added to the system to reflect that the forwarder operator no longer had to communicate with truck drivers and complete load tickets and other administrative responsibilities. | |||
| Table 4. Key performance indicators for the Ponsse Ergo harvester. | |||||||||
| Variable | Softwoods n = 436 | Hardwoods n = 71 | p-value | ||||||
| Mean | SD | Median | Mean | SD | Median | ||||
| Tree volume | m3 | 0.627 | 0.496 | 0.500 | 0.229 | 0.303 | 0.160 | <0.0001 | |
| Pieces per tree | n° | 3.0 | 1.0 | 3.0 | 1.7 | 0.8 | 2.0 | <0.0001 | |
| Cycle time per tree | s | 62 | 51 | 49 | 52 | 53 | 33 | 0.0018 | |
| Productivity | trees pmh–1 | 96 | 74 | 73 | 133 | 111 | 109 | 0.0018 | |
| Productivity | m3 pmh–1 | 41.0 | 29.6 | 36.0 | 21.9 | 18.4 | 17.1 | <0.0001 | |
| SD = Standard deviation; pmh = productive machine hours (excluding delays); m3 = cubic meters over bark; p-value returned by the non-parametric Mann-Whitney U-test. | |||||||||
| Table 5. Regression equation for the Ponsse Ergo harvester cycle time. | ||||
| Felling and processing time per tree (s) | ||||
| s = a + b × tree volume (m3) + c × hardwood | ||||
| R2 adjusted = 0.279, n = 507, RMS = 42.6 | ||||
| Coeff | SE | T | P | |
| a | 26.8 | 3.2 | 8.294 | <0.0001 |
| b | 55.6 | 4.0 | 13.905 | <0.0001 |
| c | 11.1 | 5.7 | 1.954 | 0.0513 |
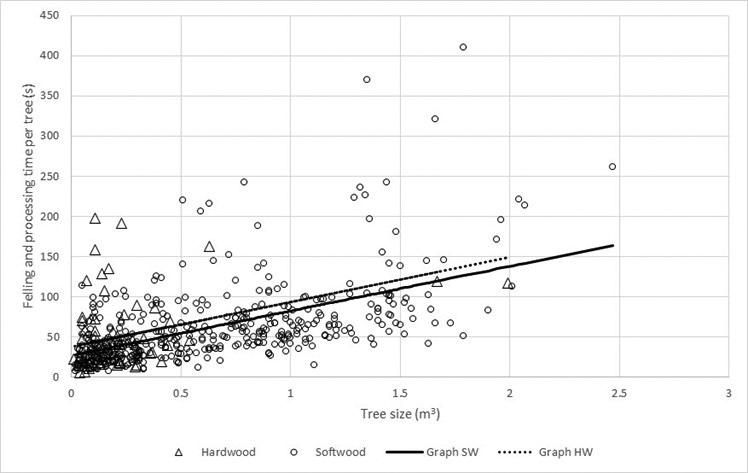
Fig. 1. Ponsse Ergo harvester cycle time (s tree–1) as a function of tree volume (m3) for both hardwood and softwood species.
| Table 6. Key performance indicators for the Ponsse Elephant forwarder. | ||||
| Variable | Unit | Mean | SD | Median |
| Outhaul | s | 552 | 151 | 532 |
| Load | s | 793 | 289 | 727 |
| Move | s | 206 | 179 | 119 |
| Inhaul | s | 486 | 151 | 511 |
| Unload onto deck | s | 337 | 130 | 298 |
| Unload onto truck | s | 523 | 134 | 485 |
| Distance | m | 631 | 223 | 622 |
| Logs | n° | 54 | 9 | 52 |
| Stops | n° | 4.6 | 1.9 | 4.0 |
| Load | m3 | 17.1 | 2.9 | 16.6 |
| Productivity | m3 pmh–1 | 25.7 | 6.1 | 26.8 |
| Outhaul | s m–1 | 0.88 | 0.22 | 0.90 |
| Inhaul | s m–1 | 0.76 | 0.28 | 0.79 |
| SD = Standard deviation; pmh = productive machine hours (excluding delays); m3 = cubic meters over bark. | ||||
| Table 7. Key performance indicators for loading with the Ponsse Elephant forwarder. | |||||||||
| Variable | Hot deck n = 14 | Cold deck n = 3 | |||||||
| Mean | SD | Median | Mean | SD | Median | p-value | |||
| Load | log n° | 88 | 13 | 90 | 85 | 9 | 88 | 0.5700 | |
| Load | m3 | 27.8 | 1.8 | 27.5 | 28.9 | 2.9 | 29.7 | 0.6143 | |
| Loading time | s | 949 | 208 | 928 | 1330 | 42 | 1332 | 0.0233 | |
| Grapple loads | n° | 24 | 3 | 23 | 24 | 3 | 24 | 0.7984 | |
| Productivity | m3 pmh–1 | 109.8 | 22.8 | 111.4 | 78.1 | 5.6 | 80.4 | 0.0233 | |
| Front n = 17 | Rear n = 17 | ||||||||
| Mean | SD | Median | Mean | SD | Median | p-value | |||
| Load | log n° | 43 | 7 | 44 | 44 | 7 | 46 | 0.9241 | |
| Load | m3 | 13.9 | 1.5 | 13.9 | 14.1 | 1.3 | 14.3 | 0.7946 | |
| Loading time | s | 470 | 131 | 477 | 546 | 135 | 523 | 0.0148 | |
| Grapple loads | n° | 11 | 2 | 11 | 12 | 2 | 12 | 0.1664 | |
| Productivity | m3 pmh–1 | 114.2 | 33.6 | 104.0 | 98.3 | 26.0 | 99.2 | 0.0759 | |
| SD = Standard deviation; pmh = productive machine hours (excluding delays); m3 = cubic meters over bark; p-value returned by the non-parametric Mann-Whitney U-test. | |||||||||
| Table 8. Individual machine and harvesting system productivity and cost of the observed system and two alternative scenarios. | |||
| Machine | Harvester | Forwarder | System |
| Loading by forwarder | |||
| Delay-free function productivity (m3 pmh–1) | 38.4 | 20.7 | |
| System productivity (m3 smh–1) | 14.5 | ||
| System onboard truck cost ($ m–3) | -- | $15.91 | |
| System cut-and-haul cost ($ m–3) | -- | $23.93 | |
| Loading by tracked loader | |||
| Delay-free function productivity (m3 pmh–1) | 38.4 | 25.9 | |
| System productivity (m3 smh–1) | 22.2 | ||
| System onboard truck cost ($ m–3) | $14.20 | ||
| System cut-and-haul cost ($ m–3) | $22.21 | ||
| Loading setout trailers with forwarder | |||
| Delay-free function productivity (m3 pmh–1) | 38.4 | 24.0 | |
| System productivity (m3 smh–1) | 19.2 | ||
| System onboard truck cost ($ m–3) | $12.99 | ||
| System cut-and-haul cost ($ m–3) | $21.00 | ||
| pmh = productive machine hours (excluding delays); smh = scheduled machine hours (including delays); m3 = cubic meters over bark. | |||