| Table 1. Summary of the variables. | |||
| Variable | Description | Type | Source |
| Fire occurrence (response) | Division into observed forest fires and pseudo-absence observations (0 = pseudo-absence, 1 = fire occurrence) | binary | PRONTO1 |
| Fire size (response) | Total burnt area in terrain types considered forest, with a logarithmic transformation (ha) | numerical | PRONTO1 |
| Coordinates | Location of the ignition point | numerical | PRONTO1 |
| Year | Calendar year (2014–2023) | numerical | PRONTO1 |
| Trafficability | Bearing capacity of the terrain (1–6; 1 = the highest, 6 = the lowest) | categorical | Soil trafficability map, Finnish Forest Centre |
| Slope | Terrain slope at the ignition point (°) | numerical | Elevation model 10 m, National Land Survey of Finland |
| Canopy cover | Proportion of ground covered by the vertical projection of tree crowns (%) | numerical | MS-NFI2 |
| Dominant species | Tree species, covering at least 50% of the total growing stock volume (Pine, Spruce, Deciduous, or Mixed) | categorical | MS-NFI2 |
| Day of year | Sequential calendar day number within the year (0–366) | numerical | PRONTO1 |
| Finnish Forest Fire Index (FFI) | Latest index value prior to fire in the municipality, to one decimal precision (1.0–6.0) | numerical | PRONTO1 |
| Ignition cause | Reclassified ignition cause, based on fire authorities' assessment (Human, Lightning, or Unknown) | categorical | PRONTO1 |
| Population density | Interpolated population density as of 31st December of the preceding year (persons km⁻2) | numerical | Population grid data 1 km × 1 km, Statistics Finland |
| Distance to nearest road | Euclidean distance between the ignition point and the nearest road, including classes road, roadway, track, pedestrian and bicycle route, and winter road (km) | numerical | Topographic Database, National Land Survey of Finland |
| 1 Finnish rescue services’ resource and accident statistics system, Emergency Services Academy Finland 2 Multi-Source National Forest Inventory, Natural Resources Institute Finland | |||
| Table 2. Summary statistics of the forest fires included in the analyses. | |||||||
| Year | Number of fires | Ignition cause (%) | Fire size (ha) | ||||
| Human | Lightning | Unknown | Median | Mean | Sum | ||
| 2014 | 1320 | 54.5 | 29.5 | 16.1 | 0.020 | 0.55 | 721 |
| 2015 | 629 | 73.9 | 3.5 | 22.6 | 0.003 | 0.17 | 107 |
| 2016 | 772 | 80.8 | 3.1 | 16.1 | 0.005 | 0.31 | 238 |
| 2017 | 746 | 82.0 | 2.1 | 15.8 | 0.010 | 0.73 | 543 |
| 2018 | 1892 | 55.1 | 19.7 | 25.3 | 0.010 | 0.48 | 910 |
| 2019 | 1071 | 62.9 | 15.1 | 21.9 | 0.005 | 0.28 | 296 |
| 2020 | 1046 | 73.6 | 10.2 | 16.2 | 0.008 | 0.65 | 683 |
| 2021 | 1019 | 58.3 | 21.6 | 20.1 | 0.005 | 0.56 | 575 |
| 2022 | 845 | 72.9 | 13.4 | 13.7 | 0.002 | 0.24 | 199 |
| 2023 | 944 | 64.7 | 16.6 | 18.6 | 0.005 | 0.35 | 330 |
| All | 10 284 | 65.4 | 15.4 | 19.2 | 0.008 | 0.45 | 460 |
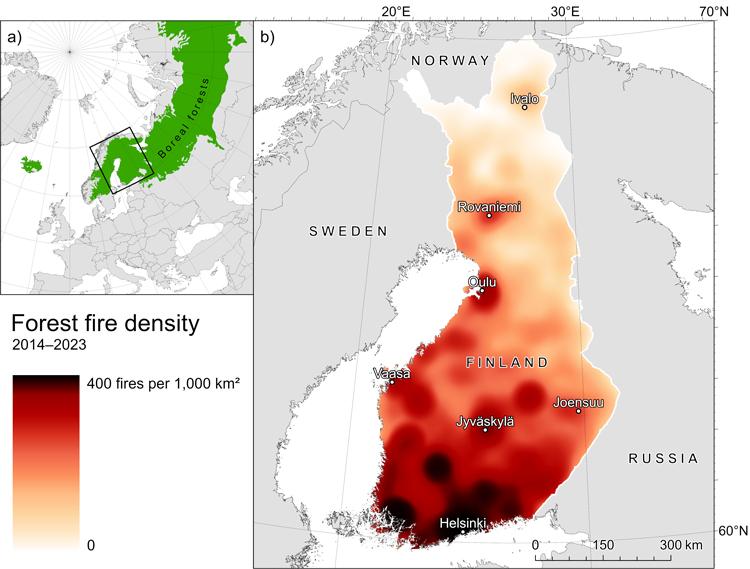
Fig. 1. Maps showing a) the location of the study area within the boreal region (University of Minnesota 2017; The World Bank 2025) and b) the spatial distribution of forest fires recorded in PRONTO, visualized as a kernel density heatmap.
| Table 3. Terms in the relative ignition probability model, listed in descending order of χ2-statistic. The s() denotes a spline function applied to the variable. | ||
| Term | χ2-value | p-value |
| s(population density) | 1567.8 | <0.001 |
| s(day of year) | 1565.6 | <0.001 |
| s(canopy cover) | 679.3 | <0.001 |
| trafficability | 317.9 | <0.001 |
| distance to nearest road | 147.0 | <0.001 |
| s(slope) | 126.3 | <0.001 |
| dominant species | 0.5 | 0.918 |
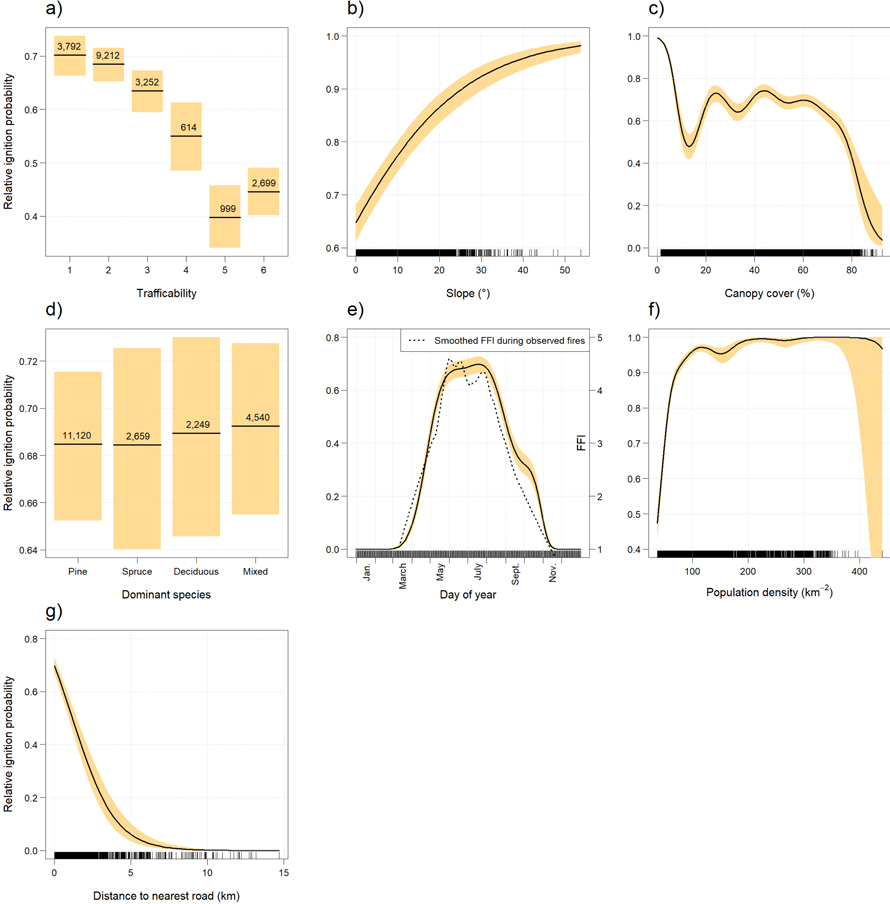
Fig. 2. Response of relative ignition probability to a) trafficability, b) slope, c) canopy cover, d) dominant species, e) day of year, f) population density, and g) distance to nearest road. Lines represent the estimated effects and shaded areas 95% confidence intervals. In panel e), the dashed smooth shows variation in the Finnish Forest Fire Index as a function of day of year based on the observed fires. For continuous variables, tick marks indicate observation density; for categorical variables, class frequencies are shown.
| Table 4. Terms in the fire size model, listed in descending order of F-statistic. The s() denotes a spline function applied to the variable. | ||
| Term | F-value | p-value |
| s(population density) | 121.7 | <0.001 |
| distance to nearest road | 76.7 | <0.001 |
| ignition cause | 76.0 | <0.001 |
| s(day of year) | 48.2 | <0.001 |
| s(Finnish Forest Fire Index) | 22.7 | <0.001 |
| trafficability | 8.5 | <0.001 |
| s(canopy cover) | 6.8 | <0.001 |
| dominant species | 6.6 | <0.001 |
| slope | 1.0 | 0.309 |
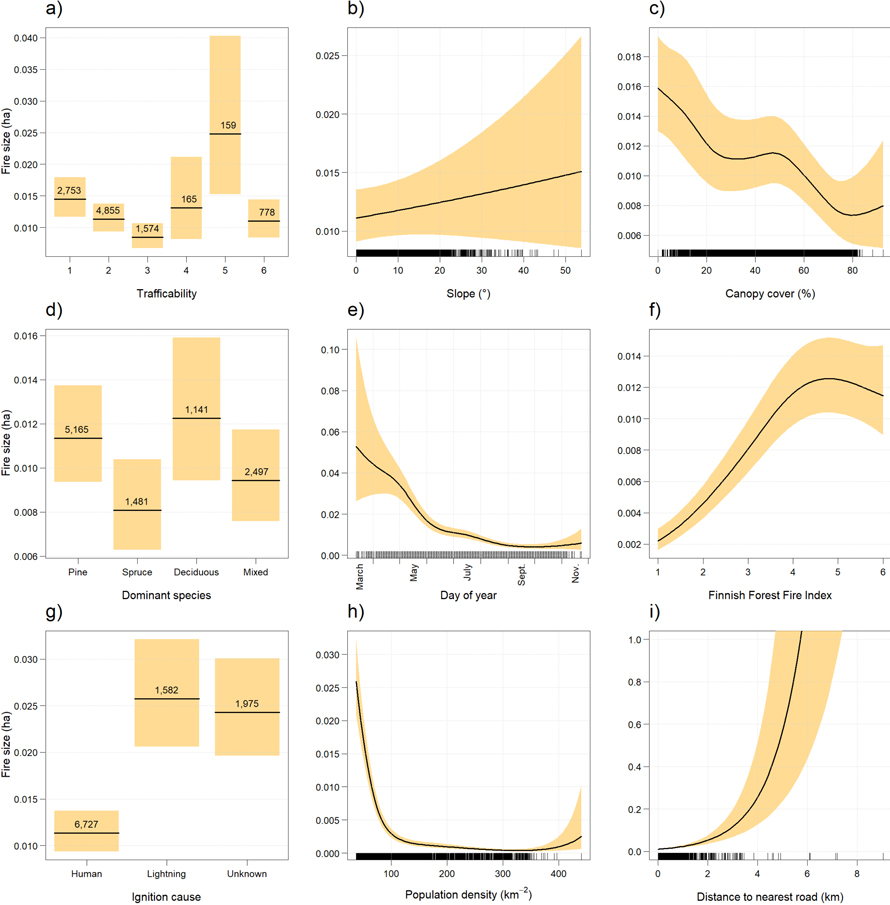
Fig. 3. Response of fire size to a) trafficability, b) slope, c) canopy cover, d) dominant species, e) day of year, f) the Finnish Forest Fire Index, g) ignition cause, h) population density, and i) distance to nearest road. Lines represent the estimated effects and shaded areas 95% confidence intervals. For continuous variables, tick marks indicate observation density; for categorical variables, class frequencies are shown.