| Table 1. Description of the trial sites within each country. The trial Id consists of country where Den = Denmark and Swe = Sweden, site type where F = Forest land and A = Agricultural land and parallel trial series number within country. TS = degree days based on daily mean temperatures >5 °C (Perttu and Moren 1995) and pH = soil acidity. | |||||||
| Trial id | Name | Site type | Planted year | Latitude, Longitude | Alt m | TS Degree days | pH |
| Den_A1 | Give | Agricultural | 2012 | 55°83´N, 09°16´E | 75 | 1552 | |
| Den_F1 | Lournkaer_Nord | Forest | 2012 | 56°72´N, 10°20´E | 1 | 1567 | |
| Den_F2 | Lournkaer-Syd | Forest | 2012 | 56°70´N, 10°14´E | 30 | 1542 | |
| Swe_A1 | Sturup | Agricultural | 2010 | 55°56´N, 13°38´E | 120 | 1466 | 5.9 |
| Swe_F1 | Matteröd | Forest | 2010 | 56°11´N, 13°62´E | 114 | 1438 | 4.2 |
| Swe_A2 | Remningstorp | Agricultural | 2010 | 58°26´N, 13°37´E | 133 | 1291 | 5.1 |
| Swe_F2 | Toftaholm | Forest | 2010 | 56°99´N, 14°05´E | 162 | 1344 | 4.8 |
| Swe_A3 | Harg | Agricultural | 2010 | 60°09´N, 18°25´E | 20 | 1276 | 7.9 |
| Swe_F3 | Karön | Forest | 2010 | 60°29´N, 18°36´E | 25 | 1267 | 7.8 |
| Swe_A4 | Ed | Agricultural | 2011 | 63°25´N, 17°23´E | 75 | 1039 | 5.2 |
| Swe_F4 | “Pommac” | Forest | 2011 | 63°11´N, 17°27´E | 265 | 888 | 4.9 |
| Swe_A5 | Degerbyn | Agricultural | 2011 | 64°78´N, 20°81´E | 20 | 993 | 4.9 |
| Swe_F5 | Degerbyn | Forest | 2011 | 64°78´N, 20°81´E | 20 | 992 | 4.4 |
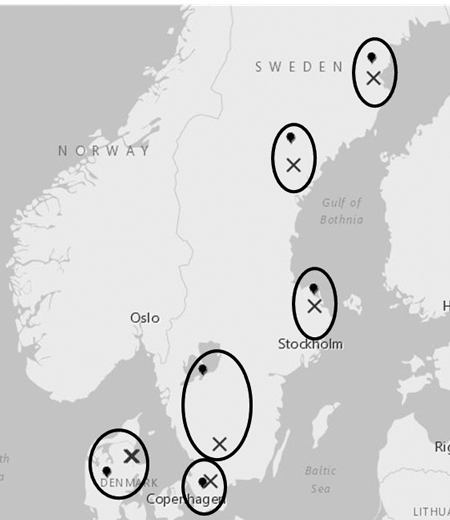
Fig. 1. Location of the trials. The parallel trials i.e. trials with similar climatic conditions and including the same test material are encircled. “X” represents forest land and the balloon symbol represents agricultural land.
| Table 2. Description of material groups per species, deployment areas and number of clones per group. “STT” = SweTree Technologies. | ||||
| Species | Main deployment area | Description | Clones N | |
| Group name | ||||
| Hybrid aspen | ||||
| Swe_S_Com | S. Sweden | Genotypically seleced clones for commercial use | 15 | |
| Swe_S_New | S. Sweden | An additional genotypic selection in trials where Swe_S_Com was tested | 11 | |
| Swe_N | N. Sweden | Phenotypic selection | 23 | |
| Finl | S. Finland | Phenotypic selection | 23 | |
| Latv | Latvia | Phenotypic selection | 22 | |
| Germ | N. Germany | Phenotypic selection | 15 | |
| Poplar | ||||
| Swe_S_Com | S. Sweden | Genotypically selected clones for commercial use (P. trichocarpa or P. maximowiczii × P. trichocarpa). Includes clone OP42 | 16 | |
| Swe_N | N. Sweden | Phenotypic selection (P. trichocarpa) | 23 | |
| Swe_STT_C | C. Sweden | Phenotypic selection STT, (P. trichocarpa) | 5 | |
| Swe_STT_N | N. Sweden | Phenotypic selection STT, (P. trichocarpa) | 9 | |
| Icel | Iceland | Phenotypic selection, (P. trichocarpa) | 7 | |
| Be | Belgium | Phenotypic selection, (P. deltoides x P. trichocarpa) | 43 | |
| Ital | Italy | Commercial clones (AF2, AF8, AF13, Monviso, AF18, AF24, AF28) | 7 | |
| EU_Com | C. Europe | Commercial clones (Grimminge, Koster and Muur). | 3 | |
| Norw | Norway | Phenotypic selection, (P. trichocarpa) | 4 | |
| Sum of clones | 226 | |||
| Table 3. Distribution of the number of hybrid aspen and poplar clones tested on different material groups and sites. See Table 2 for explanation of material groups. | |||||||||||||||
| Trial id | Material groups of Hybrid aspen | Material groups of Poplar | |||||||||||||
| Swe_S _Com | Swe_S _New | Swe _N | Finl | Latv | Germ | Swe_S _Com | Swe _N | Swe _STT_C | Swe _STT_N | Icel | Be | Ital | EU _Com | Norw | |
| Den_A1 | 15 | 11 | 4 | 15 | 6 | ||||||||||
| Den_F1 | 15 | 11 | 4 | 15 | 3 | ||||||||||
| Den_F2 | 15 | 11 | 4 | 15 | |||||||||||
| Swe_A1 | 15 | 11 | 23 | 22 | 12 | 16 | 46 | 4 | 3 | ||||||
| Swe_F1 | 15 | 11 | 23 | 22 | 12 | 16 | 46 | 4 | 3 | ||||||
| Swe_A2 | 15 | 11 | 23 | 22 | 11 | 16 | 5 | 6 | 4 | ||||||
| Swe_F2 | 15 | 11 | 23 | 22 | 11 | 16 | 5 | 6 | 4 | ||||||
| Swe_A3 | 15 | 11 | 23 | 22 | 16 | 5 | 6 | ||||||||
| Swe_F3 | 15 | 11 | 23 | 22 | 16 | 5 | 6 | ||||||||
| Swe_A4 | 15 | 10 | 23 | 23 | 4 | 13 | 5 | 3 | |||||||
| Swe_F4 | 15 | 10 | 22 | 23 | 4 | 11 | 4 | 3 | |||||||
| Swe_A5 | 15 | 10 | 23 | 23 | 15 | 22 | 3 | 7 | 4 | ||||||
| Swe_F5 | 15 | 10 | 21 | 23 | 15 | 21 | 2 | 7 | 4 | ||||||
| Table 4. Description of measured traits. | ||
| Trait | Unit | Description |
| Survival | (0–1) | Survival, classified as 0 = dead and 1 = alive |
| Height | cm | Total height |
| Flushing | (1–6) | Spring phenology based on flushing for the upper half of the living crown registered in 6 classes: 1 = dormant, 2 = buds started to swell, 3 = slightly broken buds where little green can be seen at the top, 4 = broken bud, 5 = developed leaves, 6 = fully developed leaves. Classification dates: Swe_A1: April 26, 2013 for hybrid aspen and May 7, 2013 for poplar. Swe_A2: May 11, 2013. Swe_A5: May 28, 2013. Swe_F5: May 24, 2013. |
| Coloration | (0–100) | Autum phenology classified by coloration of leaves and/or lost leaves in 10% classes where 0 = no autumn colors and/or no leaves lost … 100 = 100% autumn coloration and/or 100% lost leaves. Classification dates: Swe_A1: Oct 4 and 16, 2013. Swe_A2: Sep 17, 26 and Oct 8, 2013. Swe_A5: 27 Sept, 2013. Swe_F5: Sept 30, 2013. |
| Table 5. Average survival (%), height (cm), flushing score (1–6) and autumn coloration (%) of hybrid aspen (Hasp) and poplar (Popp) in different trials. The significance probability value associated with species is given by ”Pr > F” for each trait and site. | ||||||||||||||||
| Trial id | Survival, % | Height, cm | Flushing (1–6) | Coloration, % | ||||||||||||
| Hasp | Popp | All | Pr > F | Hasp | Popp | All | Pr > F | Hasp | Popp | All | Pr > F | Hasp | Popp | All | Pr > F | |
| Den_A1 | 91 | 89 | 91 | 0.6209 | 277 | 258 | 268 | 0.0391 | ||||||||
| Den_F1 | 94 | 70 | 86 | 0.0018 | 401 | 166 | 334 | <0.0001 | ||||||||
| Den_F2 | 94 | 89 | 93 | 0.1295 | 289 | 189 | 254 | <0.0001 | ||||||||
| Swe_A1 | 92 | 69 | 84 | 0.0018 | 351 | 295 | 335 | 0.0178 | 4.4 | 3.3 | 4.0 | 0.0024 | 67 | 49 | 62 | 0.0003 |
| Swe_F1 | 83 | 11 | 59 | <0.0001 | 281 | 100 | 270 | <0.0001 | ||||||||
| Swe_A2 | 95 | 52 | 85 | <0.0001 | 517 | 447 | 508 | 0.1063 | 3.9 | 2.7 | 3.7 | 0.0030 | 59 | 71 | 60 | 0.0045 |
| Swe_F2 | 82 | 76 | 81 | 0.1611 | 270 | 161 | 244 | 0.0007 | ||||||||
| Swe_A3 | 77 | 76 | 77 | 0.6983 | 270 | 260 | 268 | 0.0828 | ||||||||
| Swe_F3 | 93 | 83 | 90 | 0.0269 | 236 | 233 | 235 | 0.8777 | ||||||||
| Swe_A4 | 50 | 0 | 37 | 0.0255 | ||||||||||||
| Swe_F4 | 69 | 33 | 60 | 0.0690 | 192 | 38 | 152 | 0.0042 | ||||||||
| Swe_A5 | 58 | 19 | 38 | <0.0001 | 163 | 128 | 145 | 0.0203 | 5.3 | 5.5 | 5.4 | 0.1592 | 46 | 53 | 50 | 0.1428 |
| Swe_F5 | 82 | 38 | 60 | <0.0001 | 258 | 122 | 190 | <0.0001 | 5.8 | 5.7 | 5.8 | 0.3380 | 33 | 58 | 45 | 0.0047 |
| Table 6. Comparison of survival and growth within parallel trials, i.e. between agricultural land (Agri) and forest land (Forest) for sites within similar climatic conditions. Only clones belonging to the groups “Swe_S_Com” are included in the Danish and the southern Swedish sites, while the northern sites include all hybrid aspen clones from the “Swe_N” group and the 16 most northerly poplar clones in “Swe_N”. The statistical significance between each of the two compared sites is given by ”Pr > F”. | ||||||||||||||
| Site | Hybrid aspen | Poplar | ||||||||||||
| Survival, % | Height, cm | Survival, % | Height, cm | |||||||||||
| Agri | Forest | Pr > F | Agri | Forest | Pr > F | Agri | Forest | Pr > F | Agri | Forest | Pr > F | |||
| Den_A1_F1 | 91 | 93 | 0.4053 | 265 | 394 | <0.0001 | 93 | 70 | <0.0001 | 259 | 173 | <0.0001 | ||
| Den_A1_F2 | 91 | 93 | 0.5641 | 265 | 275 | 0.3590 | 93 | 89 | 0.3387 | 259 | 188 | <0.0001 | ||
| Swe_A1_F1 | 90 | 77 | 0.0005 | 376 | 281 | <0.0001 | ||||||||
| Swe_A2_F2 | 98 | 81 | <0.0001 | 530 | 290 | <0.0001 | 47 | 82 | <0.0001 | 446 | 178 | <0.0001 | ||
| Swe_A3_F3 | 79 | 92 | 0.0001 | 282 | 258 | 0.0063 | 70 | 80 | 0.0556 | 264 | 236 | 0.0068 | ||
| Swe_A4_F4 | 55 | 76 | <0.0001 | 211 | 169 | <0.0001 | ||||||||
| Swe_A5_F5 | 71 | 85 | 0.0005 | 165 | 244 | <0.0001 | ||||||||
| Table 7a. Average survival of different groups of hybrid aspen and poplar in different trials. The statistical significance of differences between the groups is given by Pr > F. Table 7b. Average height (cm) of different groups of hybrid aspen and poplar in different trials. The statistical significance of differences between the groups is given by Pr > F. View in new window/tab. |
| Table 8. Summary of means, broad sense heritabilities (H2) and genotypic coefficients of variation (CVG) for survival, height, flushing and coloration per site and species. “N_Obs” = Total number of observations, “N_Clone” = Number of clones, “SE” = Standard error of heritability. | ||||||||||||
| Trial id | Hybrid aspen | Poplar | ||||||||||
| N_Obs | N_Clone | Mean | H2 | SE | CVG | N_Obs | N_Clone | Mean | H2 | SE | CVG | |
| Survival (%) | ||||||||||||
| Den_A1 | 244 | 30 | 91 | 0.02 | 0.04 | 170 | 21 | 89 | 0.08 | 0.07 | ||
| Den_F1 | 254 | 30 | 94 | 0.06 | 0.04 | 146 | 18 | 70 | 0.03 | 0.05 | ||
| Den_F2 | 252 | 30 | 94 | 0.04 | 0.04 | 163 | 15 | 89 | 0.03 | 0.05 | ||
| Swe_A1 | 706 | 83 | 92 | 0.10 | 0.03 | 363 | 66 | 69 | 0.20 | 0.06 | ||
| Swe_F1 | 703 | 83 | 83 | 0.03 | 0.03 | 346 | 31 | 11 | 0.03 | 0.03 | ||
| Swe_A2 | 697 | 82 | 95 | 0.21 | 0.05 | 220 | 31 | 52 | 0.41 | 0.08 | ||
| Swe_F2 | 698 | 82 | 82 | 0.01 | 0.02 | 222 | 31 | 76 | 0.32 | 0.08 | ||
| Swe_A3 | 641 | 71 | 77 | - | - | 224 | 27 | 76 | 0.37 | 0.09 | ||
| Swe_F3 | 623 | 71 | 93 | 0.02 | 0.02 | 216 | 27 | 83 | 0.25 | 0.08 | ||
| Swe_A4 | 608 | 71 | 50 | 0.08 | 0.04 | |||||||
| Swe_F4 | 599 | 70 | 69 | 0.06 | 0.03 | 108 | 22 | 33 | 0.15 | 0.10 | ||
| Swe_A5 | 552 | 71 | 58 | 0.23 | 0.05 | 395 | 51 | 19 | 0.31 | 0.06 | ||
| Swe_F5 | 572 | 69 | 82 | 0.22 | 0.06 | 399 | 50 | 38 | 0.16 | 0.05 | ||
| Height (cm) | ||||||||||||
| Den_A1 | 229 | 30 | 277 | 0.23 | 0.07 | 12.3 | 151 | 21 | 258 | 0.14 | 0.08 | 8.7 |
| Den_F1 | 240 | 30 | 401 | 0.26 | 0.07 | 11.0 | 102 | 18 | 166 | - | - | - |
| Den_F2 | 239 | 30 | 289 | 0.32 | 0.08 | 13.7 | 146 | 15 | 189 | 0.25 | 0.09 | 14.1 |
| Swe_A1 | 647 | 83 | 351 | 0.26 | 0.05 | 16.3 | 250 | 66 | 295 | 0.28 | 0.06 | 14.8 |
| Swe_F1 | 580 | 83 | 281 | 0.23 | 0.05 | 16.5 | 39 | 28 | 100 | - | - | - |
| Swe_A2 | 653 | 82 | 517 | 0.20 | 0.04 | 11.5 | 110 | 31 | 447 | 0.26 | 0.11 | 13.9 |
| Swe_F2 | 569 | 82 | 270 | 0.38 | 0.05 | 17.7 | 167 | 31 | 161 | 0.23 | 0.09 | 16.8 |
| Swe_A3 | 477 | 71 | 270 | 0.20 | 0.05 | 12.9 | 167 | 27 | 260 | 0.27 | 0.09 | 12.4 |
| Swe_F3 | 579 | 71 | 236 | 0.12 | 0.04 | 14.5 | 179 | 27 | 233 | 0.11 | 0.06 | 10.5 |
| Swe_A4 | 301 | 71 | 221 | 0.23 | 0.06 | 16.3 | ||||||
| Swe_F4 | 412 | 70 | 192 | 0.31 | 0.06 | 21.8 | 36 | 22 | 38 | 0.25 | 0.28 | 20.0 |
| Swe_A5 | 322 | 64 | 163 | 0.22 | 0.07 | 17.5 | 74 | 25 | 128 | 0.04 | 0.21 | 9.1 |
| Swe_F5 | 466 | 63 | 258 | 0.28 | 0.06 | 17.2 | 151 | 37 | 122 | 0.00 | - | - |
| Flushing (1–6) | ||||||||||||
| Swe_A1 | 531 | 83 | 4.4 | 0.39 | 0.05 | 20.1 | 232 | 66 | 3.3 | 0.77 | 0.04 | 23.8 |
| Swe_A2 | 631 | 82 | 3.9 | 0.72 | 0.04 | 14.9 | 107 | 31 | 2.7 | 0.35 | 0.12 | 11.6 |
| Swe_A5 | 337 | 64 | 5.2 | 0.19 | 0.08 | 14.7 | 85 | 29 | 5.5 | 0.46 | 0.12 | 16.8 |
| Swe_F5 | 468 | 63 | 5.8 | 0.00 | - | - | 201 | 41 | 5.8 | 0.03 | 0.06 | 2.7 |
| Coloration (%) | ||||||||||||
| Swe_A1 | 611 | 83 | 67 | 0.81 | 0.03 | 37.4 | 235 | 66 | 49 | 0.68 | 0.05 | 44.1 |
| Swe_A2 | 639 | 82 | 59 | 0.71 | 0.04 | 36.5 | 107 | 31 | 70 | 0.75 | 0.07 | 29.6 |
| Swe_A5 | 325 | 64 | 46 | 0.57 | 0.06 | 42.0 | 79 | 27 | 53 | 0.35 | 0.16 | 25.5 |
| Swe_F5 | 468 | 63 | 33 | 0.43 | 0.06 | 40.0 | 177 | 41 | 58 | 0.19 | 0.09 | 18.2 |
| Table 9. Genetic correlations (rG) and their standard errors (SE) between height and phenology traits within site. Bold figures are significant at the 5% level. | ||||
| Trial id | Hybrid aspen | Poplar | ||
| rG | SE | rG | SE | |
| Height × Flushing | ||||
| Swe_A1 | 0.58 | 0.11 | 0.24 | 0.17 |
| Swe_A2 | 0.52 | 0.11 | 0.37 | 0.32 |
| Swe_A5 | 0.67 | 0.17 | ||
| Height × Coloration | ||||
| Swe_A1 | –0.70 | 0.08 | 0.05 | 0.19 |
| Swe_A2 | –0.51 | 0.12 | –0.15 | 0.28 |
| Swe_A5 | –0.46 | 0.18 | –0.11 | 0.75 |
| Swe_F5 | –0.46 | 0.15 | ||
| Table 10. Genetic site x site correlations (rGE) for survival and height for hybrid aspen and poplar. Bold figures are significant at the 5% level. “SE” = Standard error. | |||||||||||
| Trial 1 | Trial 2 | Hybrid aspen | Poplar | ||||||||
| Survival | Height | Survival | Height | ||||||||
| rGE | SE | rGE | SE | rGE | SE | rGE | SE | ||||
| Swe_A1 | Swe_F1 | 0.78 | 0.09 | ||||||||
| Swe_A1 | Swe_A2 | 0.47 | 0.19 | 0.88 | 0.08 | 0.44 | 0.34 | –0.86 | 0.21 | ||
| Swe_A1 | Swe_F2 | 0.85 | 0.07 | 0.99 | 0.45 | –0.29 | 0.37 | ||||
| Swe_A1 | Swe_F3 | 0.77 | 0.13 | 0.54 | 0.33 | 0.41 | 0.40 | ||||
| Swe_A1 | Swe_A3 | 0.98 | 0.07 | 0.69 | 0.25 | –0.54 | 0.30 | ||||
| Swe_F1 | Swe_A2 | 0.76 | 0.11 | ||||||||
| Swe_F1 | Swe_F2 | 0.80 | 0.08 | ||||||||
| Swe_F1 | Swe_F3 | 0.64 | 0.16 | ||||||||
| Swe_F1 | Swe_A3 | 0.86 | 0.11 | ||||||||
| Swe_A2 | Swe_F2 | 0.75 | 0.10 | 0.50 | 0.35 | 0.17 | 0.34 | ||||
| Swe_A2 | Swe_F3 | 0.62 | 0.16 | 0.84 | 0.13 | 0.25 | 0.39 | ||||
| Swe_A2 | Swe_A3 | 0.86 | 0.10 | 0.76 | 0.14 | 0.82 | 0.21 | ||||
| Swe_F2 | Swe_F3 | 0.75 | 0.13 | 0.80 | 0.38 | 0.61 | 0.33 | ||||
| Swe_F2 | Swe_A3 | 0.81 | 0.10 | 0.84 | 0.30 | 0.31 | 0.29 | ||||
| Swe_F3 | Swe_A3 | 0.67 | 0.17 | 0.88 | 0.12 | 0.51 | 0.31 | ||||
| Swe_A4 | Swe_F4 | 0.70 | 0.24 | 1.00 | |||||||
| Swe_A5 | Swe_F5 | 0.85 | 0.12 | 0.78 | 0.14 | 0.71 | 0.16 | ||||
| Swe_A5 | Swe_A4 | 0.56 | 0.22 | 0.85 | 0.14 | ||||||
| Swe_A5 | Swe_F4 | 0.90 | 0.10 | 0.03 | 0.40 | 1.00 | |||||
| Swe_F5 | Swe_A4 | 0.51 | 0.23 | 1.00 | |||||||
| Swe_F5 | Swe_F4 | 0.30 | 0.27 | 0.86 | 0.12 | 0.55 | 0.40 | ||||
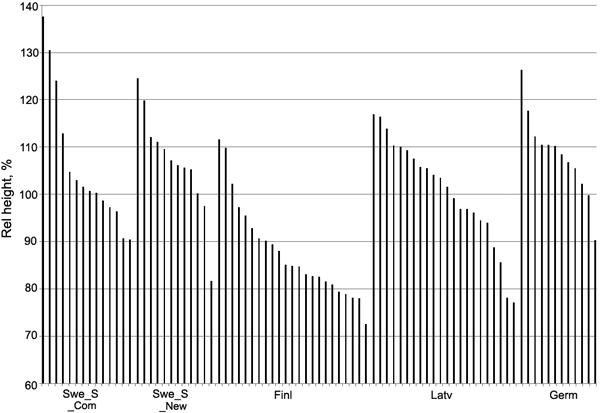
Fig. 2. Relative (%) clonal values (BLUP) for height in relation to the overall trial mean, sorted from the best to the worst clone, within each material group of hybrid aspen at site Swe_A1. Note that the y-axis starts at 60%.