| Table 1. Definition of moisture content classes (M_CL). | |
| Moisture content class (M_CL) | Moisture content % (M) |
| M_CL 2 | ≤ 29.9 |
| M_CL 3 | 30.0 – 39.9 |
| M_CL 4 | 40.0 – 49.9 |
| M_CL 5 | ≥ 50 |
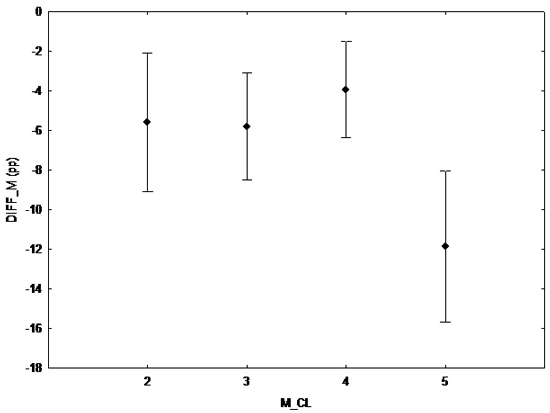
Fig. 1. The difference in moisture content (DIFF_M) pp between the capacitance meter and the reference measurement per moisture content class (M_CL). The markers show the least square mean and bars the 95% confidence interval.
| Table 2. Parameter estimates for the selected polynomial regression model with backward selection, stopped where the local minimum of the Mallows C(p) criterion was 4.02684. | ||||
| Parameter | DF | Estimate | t Value | Pr > |t| |
| Intercept | 1 | 264.090497 | 2.30 | 0.0226 |
| CAP_M | 1 | –44.201559 | –2.27 | 0.0244 |
| CAP_M2 | 1 | 3.015468 | 2.37 | 0.0187 |
| CAP_M3 | 1 | –0.095332 | –2.38 | 0.0184 |
| CAP_M4 | 1 | 0.001435 | 2.35 | 0.0200 |
| CAP_M5 | 1 | –0.000008309 | –2.30 | 0.0230 |
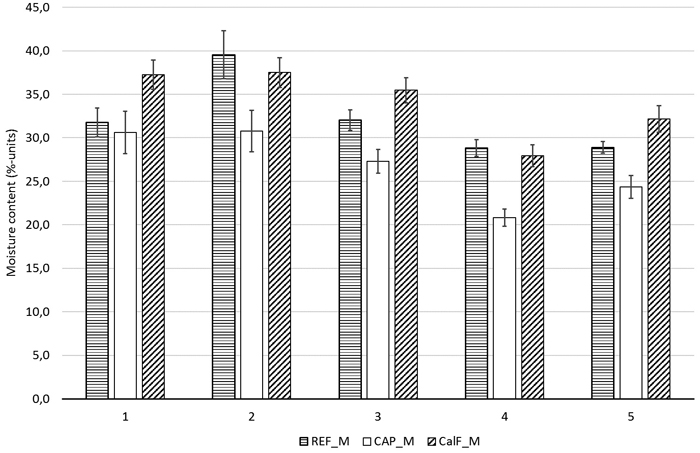
Fig. 2. Estimated mean moisture content with 95% confidence intervals for the 5 piles according to the oven drying method (REF_M), the capacitance meter (CAP_M) and the calibrated capacitance meter (CalF_M). N = 30 for each pile.
| Table 3. Least square mean and 95% confidence intervals (CI) for the difference in moisture content (DIFF_M) between the capacitance meter and the reference method, when the calibration function (CalF) was used (Yes) or not (No). | |||
| CalF | DIFF_M LSMean | 95% CI | |
| No | –5.449333 | –6.225522 | –4.673144 |
| Yes | 1.832742 | 1.056553 | 2.608931 |
| Table 4. Effects of pile (Pile) and calibration function (CalF) and the interaction (Pile × CalF) on the difference in moisture content between the capacitance meter and the reference method, from the general linear model analysis. | ||||
| Source | DF | Type III SS | F Value | Pr > F |
| Pile | 4 | 2284.109857 | 24.48 | <0.0001 |
| CalF | 1 | 3977.146342 | 170.48 | <0.0001 |
| Pile × CalF | 4 | 28.267717 | 0.30 | 0.8759 |
| Table 5. Least square means (LSMean) of difference in moisture content (DIFF_M) and grouping from Tukey pairwise test of means, were LSMeans with the same grouping letter are not significantly different. | ||
| PILE | DIFF_M LSMEAN | Tukey Grouping |
| 1 | 2.139 | a |
| 2 | –5.405 | b |
| 3 | –0.674 | c |
| 4 | –4.444 | b |
| 5 | –0.656 | c |
| Table 6. Necessary sample size (n) to estimate the population mean moisture content in each pile, by: REF_M and calibrated capacitance meter (CalF_M) within a 95% confides interval (CI) of ±2.5 and ±5.0 percentage points (pp). | ||||
| CI ± 2.5 pp | CI ± 5.0 pp | |||
| PILE | REF_M (n) | CalF_M (n) | REF_M (n) | CalF_M (n) |
| 1 | 13 | 13 | 4 | 4 |
| 2 | 34 | 13 | 9 | 4 |
| 3 | 7 | 10 | 2 | 3 |
| 4 | 5 | 8 | 2 | 2 |
| 5 | 2 | 11 | 1 | 3 |