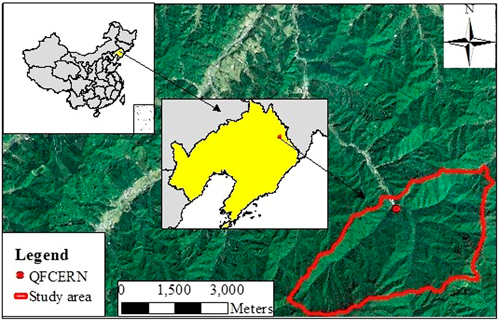
Fig. 1. The location of the study area (QFCERN: Qingyuan forest CERN).
| Table 1. The basic information for the images used in this analysis. | |||
| Year | Image Type | Source | Spatial Resolution |
| 2002 | Satellite image | SPOT 5 | Panchromatic 2.5 m; Multispectral 10.0 m |
| 2003 | Satellite image | SPOT 5 | Panchromatic 2.5 m; Multispectral 10.0 m |
| 2011 | Satellite image | SPOT 5 | Panchromatic 2.5 m; Multispectral 10.0 m |
| 2014 | Satellite image | KOMPSAT-3 | Panchromatic 0.7 m; Multispectral 2.8 m |
| Table 2. Overall accuracy and Kappa coefficients in different years detected by satellite images. Image interpretation data were compared with ground survey data. | ||
| Year | Overall accuracy (%) | Kappa coefficient |
| 2002 | 78 | 0.62 |
| 2003 | 73 | 0.68 |
| 2011 | 86 | 0.72 |
| 2014 | 82 | 0.70 |
| Table 3. The mean tree heights of five regions divided by forest types, ages and slopes. | ||
| Forest type | Age / Slope | Mean tree height |
| Larch plantation | 20 years old | 18 m |
| Larch plantation | 30 years old | 21 m |
| Larch plantation | 40 years old | 23 m |
| Secondary forest | south, southeast, east, northeast slopes | 19 m |
| Secondary forest | north, northwest, west, southwest slopes | 17 m |
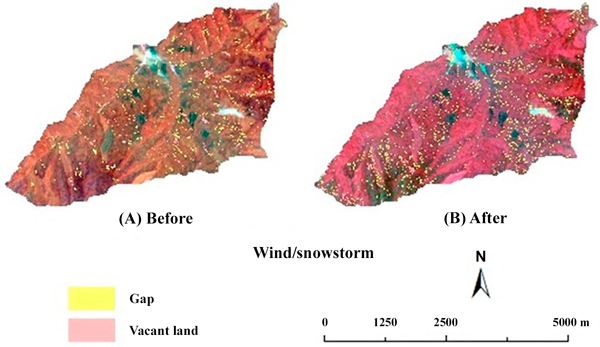
Fig. 2. The spatial patterns of gaps and vacant lands before (A) and after (B) the wind/snowstorm.
| Table 4. General characteristics of gaps and vacant lands before and after the wind/snowstorm and the flood disturbances. | |||||
| Characteristic | Wind/snowstorm | Flood | |||
| Before (2002) | After (2003) | Before (2011) | After (2014) | ||
| Gap | Fraction (%) | 3.64 | 5.1 | 3.14 | 2.71 |
| Mean size (m2) | 121 | 130 | 106 | 78 | |
| Density (ha–1) | 2.97 | 3.94 | 3.0 | 3.5 | |
| GNNI | 0.81 | 0.77 | 0.65 | 0.56 | |
| Vacant land | Fraction (%) | 0.26 | 0.27 | 0.22 | 1.10 |
| Mean size (m2) | 4488 | 4052 | 3780 | 4656 | |
| Number | 8 | 8 | 8 | 32 | |
| GNNI = gap nearest neighbor index | |||||
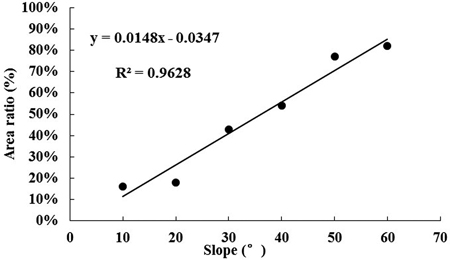
Fig. 3. Relationship between slope and area ratio of gaps induced by wind/snowstorm to total gaps, x: the upper limit of the slope classes, y: the area ratio of new gaps to total gaps.
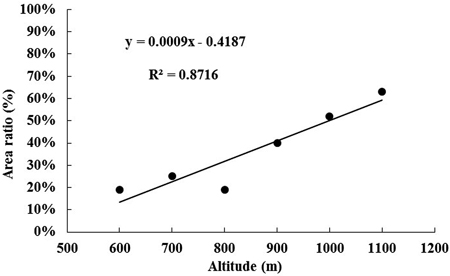
Fig. 4. Relationship between altitude and area ratio of gaps induced by wind/snowstorm to total gaps, x: the upper limit of the altitude classes, y: the area ratio of new gaps to total gaps.
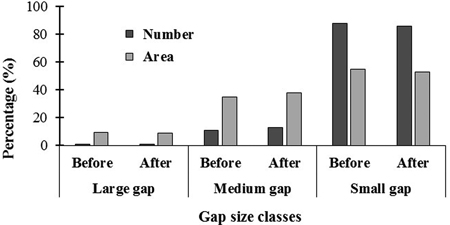
Fig. 5. The number and area percentages of gap in large, medium and small classes before and after the wind/snowstorm disturbance, x: gap size classes (divided by the ratio of gap diameter to the mean height of gap border trees, 0.23–0.73, 0.74–1.73 and 1.74–3.23 for small, medium and large gaps).
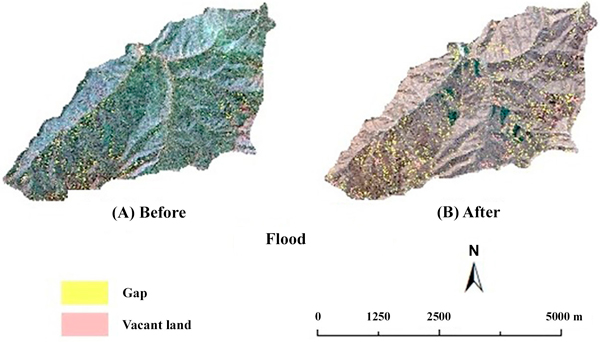
Fig. 6. The spatial patterns of gaps and vacant lands before (A) and after (B) the flood.
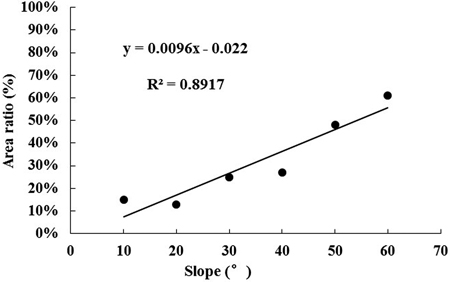
Fig. 7. Relationship between slope and area ratio of gaps induced by flood to total gaps, x: the upper limit of the slope classes, y: the area ratio of new gaps to total gaps.
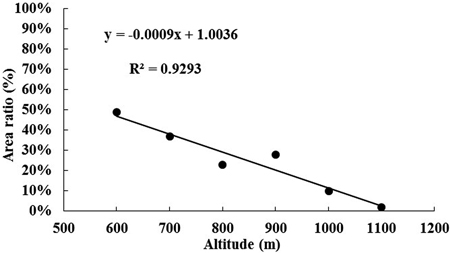
Fig. 8. Relationship between altitude and area ratio of gaps induced by flood to total gaps, x: the upper limit of the altitude classes, y: the area ratio of new gaps to total gaps.
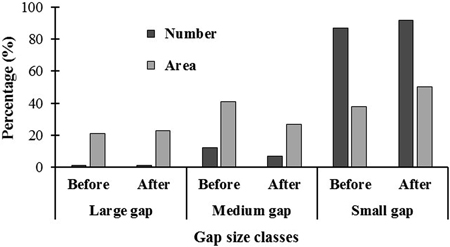
Fig. 9. The number and area percentages of gap in large, medium and small classes before and after the flood disturbance, x: gap size classes (divided by the ratio of gap diameter to the mean height of gap border trees, 0.23–0.73, 0.74–1.73 and 1.74–3.23 for small, medium and large gaps).