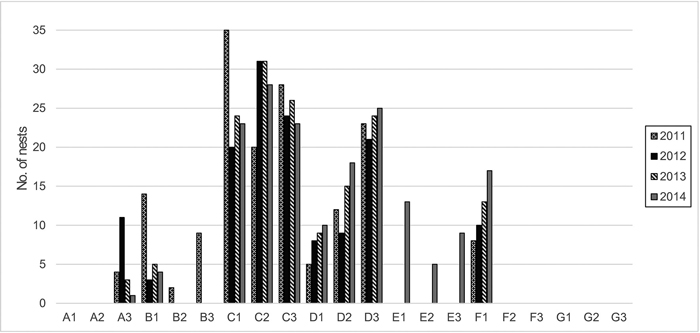
Fig. 1. Number of cormorant nests and their dynamics within the plots and a 12-m radius around them (years 2011–2014).
| Table 1. Chemical characteristics (Cc) of topsoil (A0-5) in zones A–F (data for the year 2010). Mean values and standard deviations are presented. Elemental concentrations are in g/kg. The study zones as follows: A = the oldest part of the colony in the dune hollow; B = the oldest part of the colony on the dune terraces; C = the most active part of the colony with the highest concentration of nests on the upper terrace of the dune ridge; D = the edge of the colony on the upper terrace of the dune ridge; E = relatively undamaged forest on the upper part of the dune ridge; F = relatively undamaged forest in a dune hollow. | ||||||
| Cc | Study zones | |||||
| A | B | C | D | E | F | |
| pH | 3.36±0.28 | 4.13±0.20 | 3.47±0.09 | 3.41±0.02 | 3.36±0.17 | 2.86±0.07 |
| C | 75.4±56.4 | 33.0±11.5 | 29.9±7.2 | 27.7±8.20 | 24.2±6.8 | 61.2±19.1 |
| N | 2.87±1.56 | 1.57±0.73 | 1.60±0.27 | 1.66±0.27 | 1.47±0.40 | 3.25±0.68 |
| P | 0.93±0.61 | 0.40±0.03 | 0.35 ±0.03 | 0.29 ±0.01 | 0.28 ±0.02 | 0.44 ±0.10 |
| Ca | 1.28±1.28 | 0.56±0.09 | 0.454±0.09 | 0.55±0.09 | 0.62±0.14 | 0.68±0.36 |
| K | 6.70±0.08 | 7.86±0.49 | 7.78±0.30 | 8.22±0.18 | 8.79±0.62 | 7.96±0.45 |
| Mg | 0.26±0.05 | 0.27±0.05 | 0.23 ±0.04 | 0.27 ±0.14 | 0.37 ±0.27 | 0.34 ±0.18 |
| Al | 8.18±0.75 | 8.12±0.59 | 8.23±0.52 | 8.75±0.44 | 9.63±0.82 | 8.90±0.74 |
| Na | 2.00±0.46 | 2.71±0.19 | 2.80±0.33 | 3.34±0.30 | 3.76±0.68 | 2.14±0.25 |
| Cl | 0.32±0.17 | 0.16±0.13 | 0.09 ±0.03 | 0.10 ±0.04 | 0.15 ±0.06 | 0.23 ±0.27 |
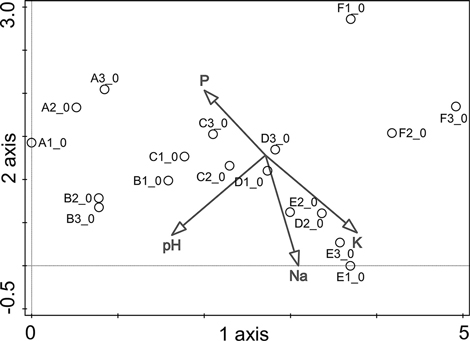
Fig. 2. Study plot distribution in DCA ordination with respect to topsoil chemistry (only statistically significant environmental variables are shown). Plots refer to the study zones A, B, C, D, E, and F. A zero in the plot number indicates the initial year of the study, 2010. P = phosphorus concentration; K = potassium concentration; Na = sodium concentration; pH = acidity of the topsoil.
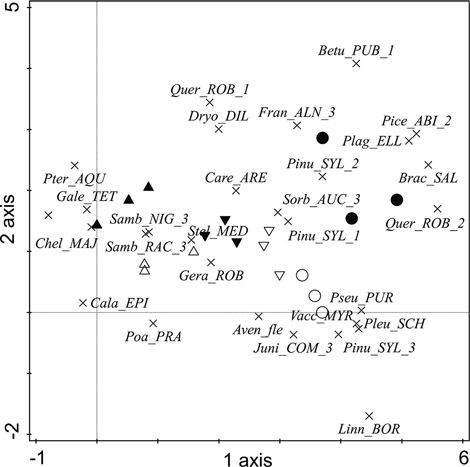
Fig. 3. The distribution of plants (the 28 species with the largest weights (8–100%) are shown) in the DCA ordination in the studied ornithogenic influence zones in the year 2010. Plot symbols are as follows: ▲ = zone A, △ = zone B, ▼ = zone C, ▽ = zone D, ○ = zone E, ● = zone F. Plant species: Aven_FLE = Avenella flexuosa, Betu_PUB = Betula pubescens, Brac_SAL = Brachythecium salebrosum, Cala_EPI = Calamagrostis epigejos, Care_ARE = Carex arenaria, Chel_MAJ = Chelidonium majus, Dryo_DIL = Dryopteris dilatata, Fran_ALN = Frangula alnus, Gale_TET = Galeopsis tetrahit, Gera_ROB = Geranium robertianum, Juni_COM = Juniperus communis, Linn_BOR = Linnea borealis, Pice_ABI = Picea abies, Pinu_SYL = Pinus sylvestris, Plag_ELL = Plagiomnium ellipticum, Pleu_SCH = Pleurozium schreberi, Poa_PRA = Poa pratensis, Pseu_PUR = Pseudoscleropodium purum, Pter_AQU = Pteridium aquilinum, Quer_ROB = Quercus robur, Samb_NIG = Sambucus nigra, Samb_RAC = Sambucus racemosa, Sorb_AUC = Sorbus aucuparia, Stel_MED = Stellaria media, Vacc_MYR = Vaccinium myrtillus. Numbers accompanying the tree and shrub species refer to the layer in which the species was recorded: 1 – canopy, 2 – understorey, 3 – shrub layer.
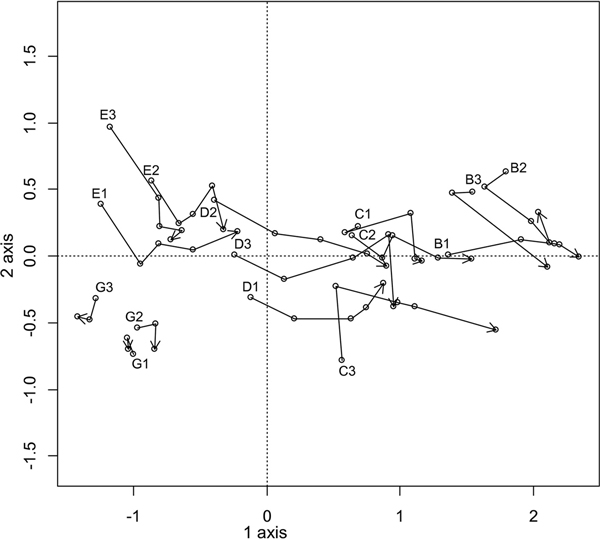
Fig. 4. Dynamics of vegetation in plots B–E and G during the period between 2010 and 2014 (the plots in zone G were established in 2012). Letters indicate the zone, whereas numbers indicate the plot number. Points marked with plot numbers represent the initial year of the survey, whereas plots marked with an arrow represent the final year of the survey.
| Table 2. Coverage (%) of vegetation layers in study zones. Mean values and standard deviations are presented. The study zones as follows: A = the oldest part of the colony in the dune hollow; B = the oldest part of the colony on the dune terraces; C = the most active part of the colony with the highest concentration of nests on the upper terrace of the dune ridge; D = the edge of the colony on the upper terrace of the dune ridge; E = initially relatively undamaged forest on the upper part of the dune ridge; F = relatively undamaged forest in a dune hollow; G = relatively undamaged pine forest on the upper part of the dune ridge. * In 2010 and 2011 the vegetation of G zone vas not investigated; zones A and F were investigated only in 2010. | |||||
| Zones | Study years | ||||
| 2010 | 2011 | 2012 | 2013 | 2014 | |
| Tree layer | |||||
| A | 2.00 ± 2.65 | * | * | * | * |
| B | 0.00 ± 0.00 | 0.00 ± 0.00 | 0.00 ± 0.00 | 0.00 ± 0.00 | 0.00 ± 0.00 |
| C | 38.33 ± 2.89 | 25.00 ± 15.00 | 11.67 ± 5.77 | 5.67 ± 4.04 | 2.67 ± 2.52 |
| D | 66.67 ± 15.28 | 48.33 ± 12.58 | 31.67 ± 7.64 | 31.67 ± 20.21 | 14.33 ± 13.58 |
| E | 60.67 ± 9.81 | 59.00 ± 6.93 | 53.67 ± 11.93 | 48.33 ± 14.43 | 48.33 ± 17.56 |
| F | 80.00 ± 8.66 | ||||
| G | * | * | 46.00 ± 3.61 | 46.00 ± 3.61 | 46.00 ± 3.61 |
| Shrub layer | |||||
| A | 13.33 ± 7.64 | * | * | * | * |
| B | 4.67 ± 4.62 | 10.00 ± 5.00 | 17.67 ± 5.86 | 18.00 ± 12.02 | 40.00 ± 42.43 |
| C | 10.33 ± 10.97 | 7.33 ± 6.66 | 12.83 ± 10.54 | 13.17 ± 8.13 | 5.83 ± 5.53 |
| D | 20.33 ± 17.04 | 10.50 ± 9.96 | 7.33 ± 2.31 | 12.33 ± 2.08 | 5.33 ± 2.02 |
| E | 11.67 ± 2.89 | 6.67 ± 4.62 | 6.83 ± 2.84 | 10.17 ± 7.65 | 14.70 ± 8.98 |
| F | 14.33 ± 13.65 | ||||
| G | * | * | 4.50 ± 1.32 | 5.33 ± 1.76 | 5.67 ± 1.53 |
| Field layer | |||||
| A | 73.33 ± 11.55 | * | * | * | * |
| B | 10.00 ± 4.00 | 8.67 ± 6.03 | 64.67 ± 23.18 | 46.50 ± 21.92 | 67.50 ± 10.61 |
| C | 14.00 ± 10.15 | 4.67 ± 3.21 | 10.50 ± 3.77 | 5.33 ± 4.48 | 3.40 ± 2.95 |
| D | 40.00 ± 13.23 | 17.33 ± 16.65 | 18.67 ± 7.09 | 7.07 ± 2.70 | 5.57 ± 3.89 |
| E | 88.33 ± 5.77 | 94.33 ± 4.04 | 94.00 ± 1.73 | 82.67 ± 6.43 | 55.83 ± 34.41 |
| F | 46.67 ± 30.55 | ||||
| G | * | * | 76.67 ± 5.77 | 79.33 ± 11.59 | 56.67 ± 17.56 |
| Bottom layer | |||||
| A | 0.17 ± 0.29 | * | * | * | * |
| B | 0.00 ± 0.00 | 0.00 ± 0.00 | 0.00 ± 0.00 | 0.00 ± 0.00 | 0.00 ± 0.00 |
| C | 0.00 ± 0.00 | 0.00 ± 0.00 | 0.00 ± 0.00 | 0.00 ± 0.00 | 0.00 ± 0.00 |
| D | 10.00 ± 10.00 | 0.00 ± 0.00 | 0.00 ± 0.00 | 0.00 ± 0.00 | 0.00 ± 0.00 |
| E | 56.67 ± 25.17 | 5.67 ± 4.04 | 8.17 ± 3.33 | 6.00 ± 5.29 | 9.70 ± 13.39 |
| F | 37.67 ± 39.07 | ||||
| G | * | * | 73.33 ± 15.28 | 13.50 ± 4.27 | 38.50 ± 27.55 |
| Open forest floor | |||||
| A | 20.00 ± 13.23 | * | * | * | * |
| B | 29.67 ± 4.51 | 44.00 ± 36.10 | 9.67 ± 13.32 | 30.00 ± 21.21 | 5.00 ± 0.00 |
| C | 83.00 ± 12.12 | 88.50 ± 12.02 | 75.67 ± 17.93 | 93.67 ± 5.13 | 90.33 ± 5.51 |
| D | 50.00 ± 17.32 | 82.33 ± 9.29 | 72.67 ± 11.02 | 89.67 ± 4.51 | 90.33 ± 6.43 |
| E | 2.00 ± 1.73 | 3.00 ± 1.73 | 0.83 ± 1.44 | 9.33 ± 7.67 | 34.33 ± 36.90 |
| F | 20.67 ± 34.08 | * | * | * | * |
| G | * | * | 3.33 ± 4.04 | 8.67 ± 6.35 | 20.33 ± 15.04 |