| Table 1. Stem height and diameter at base (0.1 cm sampling height) (January 2015), leader length (2014), mean needle density (* per 5 cm mid-section of branch) in 2014 leader, and SLA (specific leaf area) for 2014 for all assessed clones. Values shown are means ± 1 S.E pooled across the two sites. Means sharing the same letter did not differ significantly (P ≤ 0.05). n = 8. | |||||
| Clone | Height (m) | Diameter (mm) | Leader length ʼ14 (cm) | Needle density * | SLA (cm2 g−1) |
| 1 | 2.32 ± 0.1a | 1 42.4 ± 5a | 87 ± 4.11a | 64 ± 4.05b | 7.50 ± 0.39ab |
| 2 | 1.99 ± 0.1b | 41.8 ± 5a | 68 ± 8.18b | 85 ± 5.32a | 7.86 ± 0.31ab |
| 3 | 1.77 ± 0.1bc | 34.9 ± 5b | 50 ± 3.00c | 86 ± 6.19a | 6.86 ± 0.46b |
| 4 | 1.69 ± 0.1c | 32.8 ± 5b | 56 ± 2.27bc | 76 ± 3.69ab | 9.06 ± 0.50a |
| 5 | 1.56 ± 0.2c | 33.1 ± 4b | 42 ± 4.89c | 86 ± 5.87a | 8.27 ± 0.43ab |
| 6 | 1.53 ± 0.1c | 32.6 ± 5b | 56 ± 7.63bc | 71 ± 4.75ab | 7.84 ± 0.27ab |
| Table 2. ANOVA summary for sources of variation and significance of P-values for mean ring width, ring density, mean radial tracheid width and cell wall thickness with each of their corresponding values for early, transition, and late wood respectively in ring 4. NS = > 0.05, * = < 0.05 and ** = < 0.01. | ||
| P-value | ||
| Source of variation | Site (S) | Clone (C) |
| Mean ring width | NS | ** |
| 1. Earlywood ring width | NS | ** |
| 2. Transitionwood ring width | NS | NS |
| 3. Latewood ring width | NS | * |
| Mean density | NS | ** |
| 1. Earlywood density | NS | ** |
| 2. Transitionwood density | NS | NS |
| 3. Latewood density | * | NS |
| Mean radial tracheid width | NS | ** |
| 1. Earlywood radial tracheid width | NS | ** |
| 2. Transitionwood radial tracheid width | NS | * |
| 3. Latewood radial tracheid width | ** | * |
| Mean cell wall thickness | NS | ** |
| 1. Earlywood cell wall thickness | NS | * |
| 2. Transitionwood cell wall thickness | NS | NS |
| 3. Latewood cell wall thickness | ** | NS |
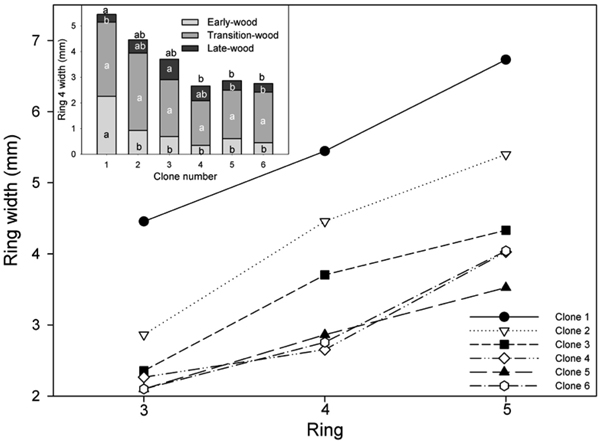
Fig. 1. Mean ring width for all clones for annual rings 3–5 and (inset) width of EW, TW and LW in ring 4. Values shown are means pooled across the two sites (site effects not significant). Means sharing the same letter did not differ significantly (P ≤ 0.05). Letters above each bar denote significant differences in mean ring width pooled across the three wood types (P ≤ 0.05). n = 8.
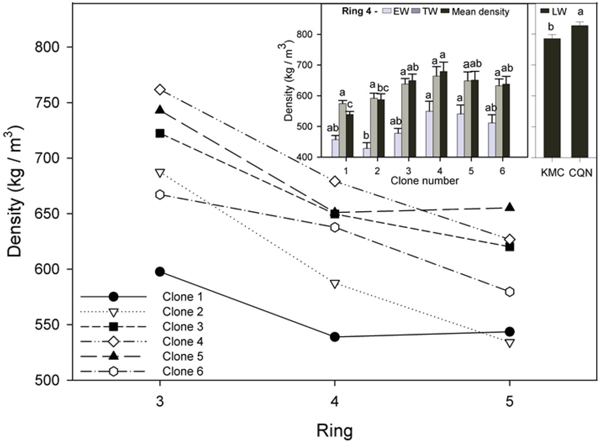
Fig. 2. Mean density for all clones for annual rings 3–5 and (inset) EW, TW, and mean density for all clones in ring 4. Values shown are means ± 1 S.E pooled across the two sites for EW and TW (site effects not significant). Values for LW varied by site and are shown separately. Means sharing the same letter did not differ significantly (P ≤ 0.05). n = 8.
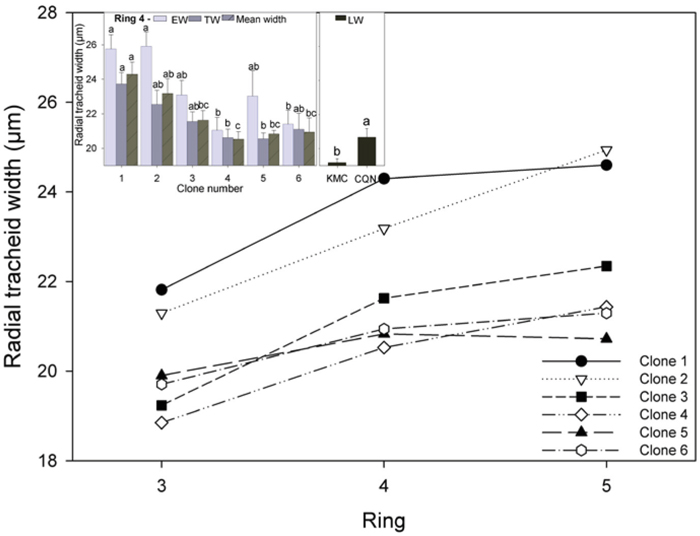
Fig. 3. Mean radial tracheid width for all clones for rings 3–5 and (inset) EW, TW, and mean radial tracheid width in ring 4. Values shown are means ± 1 S.E pooled across the two sites for EW and TW (site effects not significant). Values for LW varied by site and are shown separately. Means sharing the same letter did not differ significantly (P ≤ 0.05). n = 8.
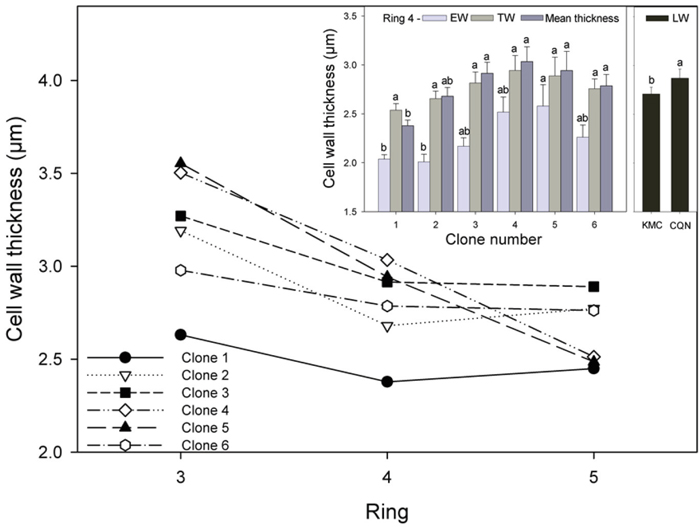
Fig. 4. Mean cell wall thickness for all clones for rings 3–5 and (inset) EW, TW, and mean cell wall thickness for all clones in ring 4. Values shown are means ± 1 S.E pooled across the two sites for EW and TW (site effects not significant). Values for LW varied by site and are shown separately. Means sharing the same letter did not differ significantly (P ≤ 0.05). n = 8.
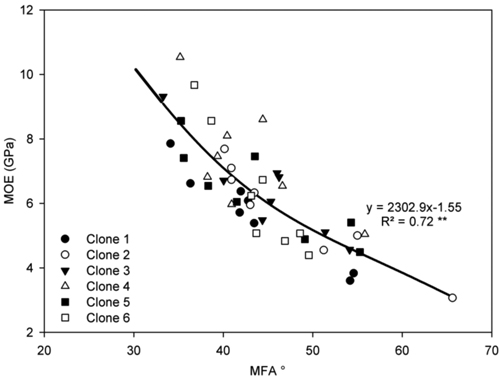
Fig. 5. Relationship between MFA and MOE in ring 4 for all ramets of each clone on both sites. Curve represent a polynomial regression. **P < 0.001. n = 48.
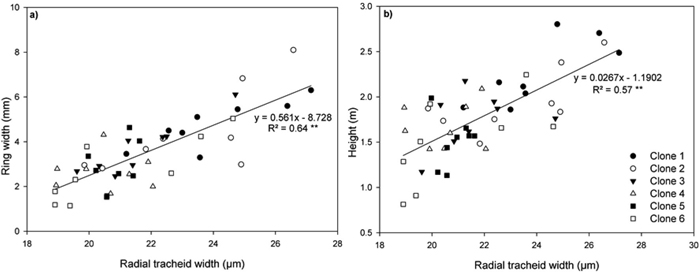
Fig. 6. Relationship between (a) ring width and radial tracheid width and (b) height and radial tracheid width in ring 4 for all clones on both sites. Each line represent linear regressions through all data points. Symbols represent each individual clone. **P < 0.001. n = 48. View larger in new window/tab.