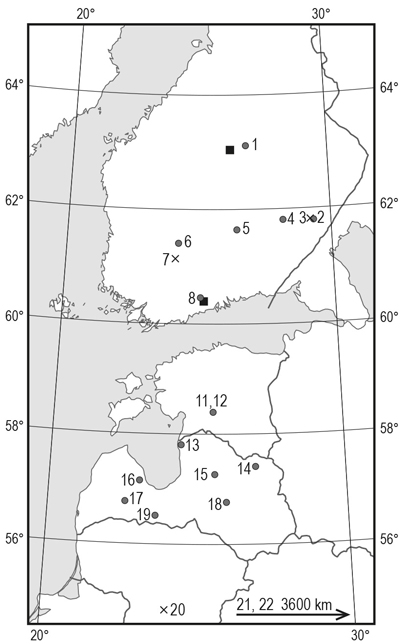
Fig. 1. Silver birch seed origins and location of the two field trials included in this study. ● = stand seed orgin, × = single tree origin, ■ = field trial. Numbering of origins refers to Table 1.
| Table 1. Silver birch seed origins included in this study. FIN = Finland, EST = Estonia, LVA = Latvia, LTU = Lithuania, RUS = Russia. Numbering of origins refers to Fig. 1. | ||||
| Origin | Latitude (N) | Longitude (E) | Altitude, m | |
| 1 | FIN, Pielavesi | 63°18´ | 26°49´ | 165 |
| 2 | FIN, Punkaharju | 61°48´ | 29°18´ | 92 |
| 3a | FIN, E1987 Punkaharju | 61°48´ | 29°18´ | 80 |
| 4 | FIN, Sulkava | 61°48´ | 28°10´ | 110 |
| 5 | FIN, Joutsa | 61°40´ | 26°15´ | 110 |
| 6 | FIN, Kangasala | 61°25´ | 24°09´ | 50 |
| 7a | FIN, E2812 Valkeakoski | 61°12´ | 24°00´ | 90 |
| 8 | FIN, Tuusula | 60°27´ | 24°58´ | 50 |
| 9a | FIN, E3012 Tuusula × E2378 Punkaharju | 60°22´ / 61°48´ | 25°03´ / 29°19´ | 60 / 80 |
| 10a | FIN, E3013 Tuusula × E2812 Valkeakoski | 60°22´ / 61°12´ | 25°03´ / 24°00´ | 60 / 90 |
| 11 | EST, Viljandi | 58°20´ | 25°30´ | |
| 12 | EST, Viljandi | 58°20´ | 25°30´ | |
| 13b | LVA, Salacgrīva | 57°49´ | 24°21´ | 10 |
| 14 | LVA, Alūksne | 57°28´ | 26°59´ | 180 |
| 15 | LVA, Liepa | 57°22´ | 25°30´ | 100 |
| 16 | LVA, Dursupe | 57°11´ | 22°58´ | 20 |
| 17 | LVA, Saldus | 56°42´ | 22°27´ | 120 |
| 18 | LVA, Jaunkalsnava | 56°41´ | 25°55´ | 100 |
| 19 | LVA, Zaļenicki | 56°31´ | 23°29´ | 30 |
| 20a | LTU, U8863 Girionys | 54°50´ | 24° | 72–100 |
| 21 | RUS, Novosibirskaya obl., Maslyanino | 54°30´ | 84° | |
| 22 | RUS, Novosibirskaya obl., Maslyanino | 54°30´ | 84° | |
| a single tree progeny b mixture of Betula pendula and Betula pubescens; excluded from the analysis | ||||
| Table 2. Average height and diameter at breast height (dbh) of the sample trees and their variation at the Viitasaari (63°11´N) and Tuusula (60°21´N) trials. The local origin at Viitasaari is Pielavesi (63°18´N) and that at the Tuusula trial is Tuusula (60°27´N). p-values indicate the significance of differences among origins and between the Finnish and Baltic groups of origins. Eight trees /origin /trial were sampled. N total = 168 (Tuusula) and 151 (Viitasaari). | ||||||||||||
| Trait | Trial | Average | SD | Min | Max | Lowest origin mean | Highest origin mean | Local origin mean | p origins | Baltic group mean | Finnish group mean | p groups |
| Height (m) | Viitasaari | 13.9 | 1.43 | 8.9 | 16.7 | 11.9 | 15.2 | 14.1 | <0.001 | 13.7 | 14.3 | 0.028 |
| Tuusula | 14.8 | 1.88 | 9.1 | 18.6 | 12.4 | 16.7 | 13.8 | <0.001 | 15.6 | 14.5 | <0.001 | |
| Dbh (cm) above bark | Viitasaari | 12.5 | 2.58 | 6.3 | 18.4 | 10.9 | 14.9 | 12.6 | ns | 12.7 | 12.7 | ns |
| Tuusula | 11.3 | 2.65 | 5.4 | 17.7 | 9.2 | 12.9 | 10.9 | ns | 11.9 | 11.0 | 0.044 | |
| Dbh (cm) below bark | Viitasaari | 11.6 | 2.38 | 5.8 | 17.2 | 9.8 | 13.5 | 11.8 | ns | 11.9 | 11.9 | ns |
| Tuusula | 10.6 | 2.53 | 5.1 | 17.1 | 8.8 | 12.2 | 10.2 | ns | 11.2 | 10.4 | ns | |
| SD = standard deviation. | ||||||||||||
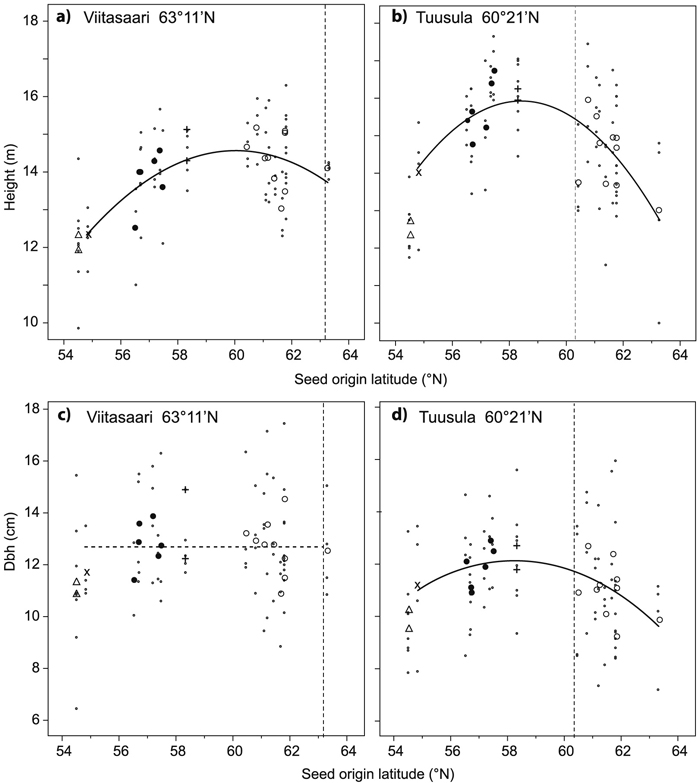
Fig. 2. Average height (ab) and diameter at breast height (dbh) (cd) of the silver birch origins in relation to seed origin latitude for the Viitasaari (ac) and Tuusula (bd) trials. The second order curves are based on the plot means, excluding Novosibirsk. ∙ = plot mean (mean of the two sample trees in a plot), bigger symbols are origin means (means of four plots) from different countries: ○ = Finland, + = Estonia, ● = Latvia, × = Lithuania, ∆ = Novosibirsk, Russia. A solid curve indicates a significant effect of latitude and a dashed curve a nonsignificant one. Latitude of the field trial is indicated by the vertical dashed line.
| Table 3. The parameter values of models (Eq. 1 and 2) for six response variables in the Viitasaari and Tuusula trials and p-values for the fixed factors included in the linear mixed models from which the parameter values of the models are determined. R2 is the coefficient of determination (%) for seed origin latitude (Eq. 3). | ||||||||||||
| Response variable | Trial | Intercept | Latitude | Latitude2 | Height | Dbh | Residual variance | R2 | ||||
| Coefficient | p | Coefficient | p | Coefficient | p | Coefficient | p | |||||
| Height a | Viitasaari | –278.25 | 9.75 | 0.002 | –0.081 | 0.002 | 0.964 | 21 | ||||
| Tuusula | –441.82 | 15.66 | <0.001 | –0.134 | <0.001 | 1.344 | 30 | |||||
| Dbh a | Viitasaari | 12.7 | 3.577 | - | ||||||||
| Tuusula | –318.62 | 11.36 | 0.048 | –0.098 | 0.045 | 3.725 | 8 | |||||
| Basic density 1.3 m b | Viitasaari | 366.45 | 7.618 | 0.001 | 364.950 | - | ||||||
| Tuusula | 692.22 | –3.55 | <0.001 | 309.190 | 19 | |||||||
| Basic density 3 m b | Viitasaari | 467.98 | 450.468 | - | ||||||||
| Tuusula | 3716.74 | –107.69 | 0.038 | 0.892 | 0.042 | 300.765 | 12 | |||||
| Bark thickness b | Viitasaari | 10.92 | –0.19 | <0.001 | 0.348 | <0.001 | 0.844 | 19 | ||||
| Tuusula | 11.34 | –0.19 | <0.001 | 0.306 | <0.001 | 0.749 | 21 | |||||
| Relative bark thickness b | Viitasaari | 21.69 | –0.26 | <0.001 | 1.736 | 17 | ||||||
| Tuusula | 23.48 | –0.29 | <0.001 | 1.767 | 21 | |||||||
| a Eq. 1 was used. b Eq. 2 was used. Dbh = diameter at breast height. | ||||||||||||
| Table 4. Average basic density (kg m–3) and its variation at different heights of the stem at the Viitasaari (63°11´N) and Tuusula (60°21´N) trials. The local origin at Viitasaari is Pielavesi (63°18´N) and that at the Tuusula trial is Tuusula (60°27´N). p-values indicate the significance of differences among origins and between the Finnish an Baltic groups of origins. Eight trees /origin /trial were sampled. N total = 168 (Tuusula) and 151 (Viitasaari). | ||||||||||||
| Measuring height | Trial | Average | SD | Min | Max | Lowest origin mean | Highest origin mean | Local origin mean | p origins | Baltic group mean | Finnish group mean | p groups |
| 0 m | Viitasaari | - | - | - | - | - | - | - | - | - | - | - |
| Tuusula | 511 | 26.6 | 428 | 576 | 487 | 531 | 494 | ns | 514 | 508 | ns | |
| 1.3 m | Viitasaari | 473 | 29.9 | 388 | 554 | 456 | 497 | 467 | ns | 468 | 478 | 0.044 |
| Tuusula | 481 | 25.7 | 407 | 546 | 458 | 510 | 458 | <0.001 | 489 | 475 | 0.001 | |
| 3 m | Viitasaari | 468 | 30.6 | 394 | 543 | 446 | 490 | 469 | ns | 464 | 471 | ns |
| Tuusula | 470 | 24.3 | 418 | 538 | 448 | 496 | 448 | <0.001 | 475 | 467 | ns | |
| 6 m | Viitasaari | 463 | 28.1 | 408 | 545 | 442 | 483 | 456 | ns | 459 | 466 | ns |
| Tuusula | 462 | 26.9 | 396 | 538 | 436 | 483 | 447 | <0.001 | 470 | 460 | 0.021 | |
| SD = standard deviation. | ||||||||||||
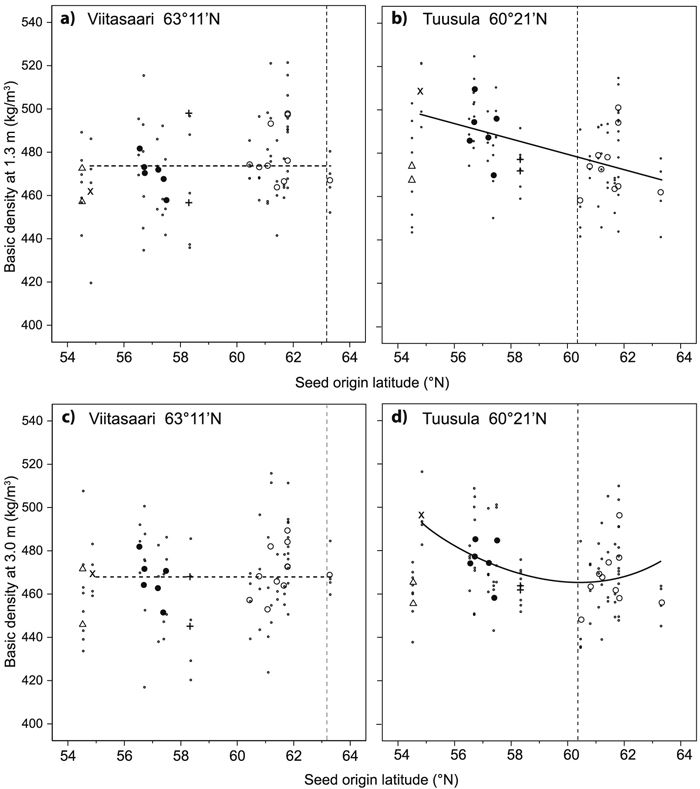
Fig. 3. Wood density at height 1.3 m (ab) and at height 3 m (cd) of silver birch origins in relation to seed origin latitude for the Viitasaari (ac) and Tuusula (bd) trials. The first order lines (abc) and second order curve (d) are based on the plot means, excluding Novosibirsk. ∙ = plot mean (mean of the two sample trees in the plot), bigger symbols are origin means (mean of four plots) from different countries: ○ = Finland, + = Estonia, ● = Latvia, × = Lithuania, ∆ = Novosibirsk, Russia. A solid line indicates a significant effect of latitude and a dashed line a nonsignificant one. Latitude of the field trial is indicated by the vertical dashed line.
| Table 5. Average bark thickness (mm) and its variation at different heights of the stem at the Viitasaari (63°11´N) and Tuusula (60°21´N) trials. The local origin at Viitasaari is Pielavesi (63°18´N) and that at Tuusula trial is Tuusula (60°27´N). p-values indicate the significance of differences among origins and between the Finnish and Baltic groups of origins. Eight trees /origin /trial were sampled. N total = 168 (Tuusula) and 151 (Viitasaari). | ||||||||||||
| Measuring height | Trial | Average | SD | Min | Max | Lowest origin mean | Highest origin mean | Local origin mean | p origins | Baltic group mean | Finnish group mean | p groups |
| 0 m | Viitasaari | - | - | - | - | - | - | - | - | - | - | |
| Tuusula | 11.4 | 4.51 | 2.5 | 24.3 | 6.7 | 15.5 | 9.8 | 0.023 | 12.6 | 10.0 | 0.001 | |
| 1.3 m | Viitasaari | 4.2 | 1.64 | 0.2 | 12.5 | 3.3 | 7.1 | 3.8 | ns | 4.6 | 3.8 | 0.005 |
| Tuusula | 3.6 | 1.64 | 1.0 | 11.3 | 2.2 | 5.4 | 3.7 | 0.003 | 4.1 | 3.1 | <0.001 | |
| 3 m | Viitasaari | 2.9 | 0.96 | 1.3 | 6.7 | 2.4 | 3.8 | 2.4 | ns | 3.1 | 2.9 | ns |
| Tuusula | 2.7 | 0.86 | 1.0 | 5.5 | 2.2 | 3.3 | 2.3 | ns | 3.0 | 2.5 | <0.001 | |
| 6 m | Viitasaari | 2.4 | 0.85 | 1.0 | 6.3 | 2.0 | 3.5 | 2.2 | ns | 2.6 | 2.3 | ns |
| Tuusula | 2.2 | 0.82 | 0.0 | 4.7 | 1.6 | 2.9 | 1.7 | ns | 2.4 | 2.1 | 0.033 | |
| SD = standard deviation. | ||||||||||||
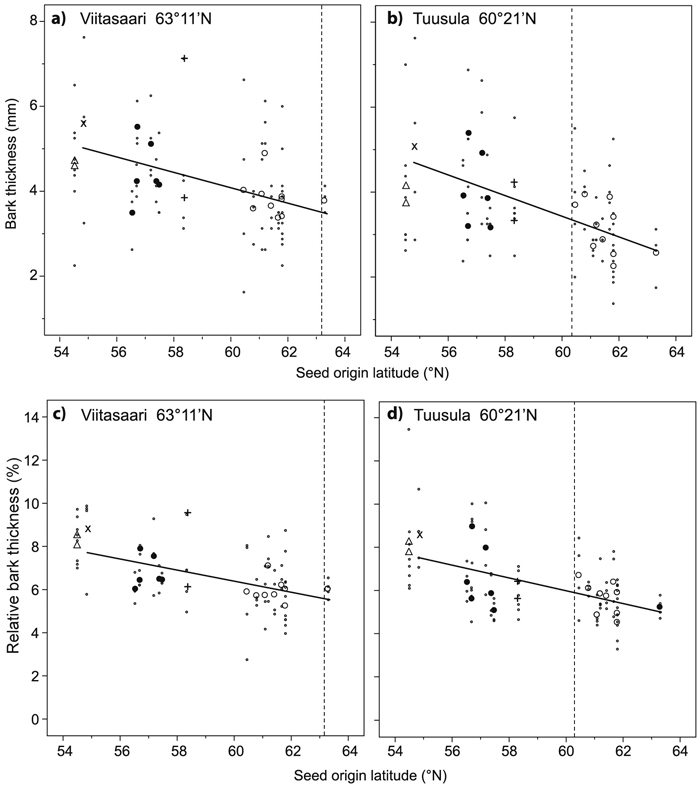
Fig. 4. Bark thickness (ab) and relative proportion of the bark from diameter over bark (cd) in relation to seed origin latitude for the Viitasaari (ac) and Tuusula (bd) trials. The first order lines are based on the plot means, excluding Novosibirsk. ∙ = plot mean (mean of the two sample trees in the plot), bigger symbols are origin means (mean of four plots) from different countries: ○ = Finland, + = Estonia, ● = Latvia, × = Lithuania, ∆ = Novosibirsk, Russia. A solid line indicates a significant effect of latitude. Latitude of the field trial is indicated by the vertical dashed line.
| Table 6. Proportion of trees (%) with darkened core wood, frost crack or decay and their variation at the Viitasaari (63°11´N) and Tuusula (60°21´N) trials. The local origin at Viitasaari is Pielavesi (63°18´N) and that at the Tuusula trial is Tuusula (60°27´N). Eight trees /origin /trial were sampled. Here one sample tree is equivalent to 12.5%. N total = 168 (Tuusula) and 151 (Viitasaari). | ||||||
| Trait | Trial | Average | SD | Lowest origin | Highest origin | Local origin |
| Black pith | Viitasaari | 54 | 30 | 0 | 100 | 88 |
| Tuusula | 81 | 12 | 63 | 100 | 75 | |
| Frost crack | Viitasaari | 15 | 14 | 0 | 50 | 13 |
| Tuusula | 5 | 8 | 0 | 25 | 0 | |
| Decay | Viitasaari | 6 | 8 | 0 | 25 | 0 |
| Tuusula | 5 | 6 | 0 | 13 | 0 | |
| SD = standard deviation. | ||||||