| Table 1. Mean values of studied traits for plus-trees and neighboring Norway spruce or Scots pine trees (data set 1). | |||||
| Variable | Scots pine, 3560* | Norway spruce, 4615* | |||
| Plus-trees, 238* | Neighboring trees, 3322* | Plus-trees, 308* | Neighboring trees, 4307* | ||
| height (m) | 11.7 (3.3) | 9.1 (3.1) | 12.8 (3.5) | 9.6 (3.6) | |
| diameter at breast height (cm) | 16.0 (3.5) | 12.3 (3.8) | 16.7 (4.6) | 11.3 (4.4) | |
| height-diameter ratio | 0.73 (0.12) | 0.75 (0.20) | 0.77 (0.10) | 0.86 (0.16) | |
| * Number of trees. Standard deviations are given in parenthesis. | |||||
| Table 2. List of trials for data set 2. | |||||||||||
| Trial no. | Tree species | Spacing (m) | Total no. of families | No. of families from PTWNT* | No. of families from NT** | No. of replicates | Established (year) | Age at measurement (years) | Mean dbh (cm) | Mean height (m) | Mean h/dbh (m/cm) |
| 1021 | Spruce | 1.4×1.4 | 81 | 8 | 24 | 24 | 1986 | 15 | 5.1 | 4.7 | 0.96 |
| 1022 | Spruce | 1.4×1.4 | 81 | 8 | 24 | 24 | 1986 | 15 | 6.1 | 5.4 | 0.97 |
| 1023 | Spruce | 1.4×1.4 | 81 | 8 | 24 | 24 | 1986 | 15 | 3.3 | 3.4 | 1.26 |
| 1024 | Spruce | 1.4×1.4 | 81 | 8 | 24 | 24 | 1986 | 15 | 5.6 | 5.6 | 1.03 |
| 1025 | Spruce | 1.4×1.4 | 81 | 7 | 18 | 24 | 1986 | 15 | 4.2 | 3.9 | 0.98 |
| 1026 | Spruce | 1.4×1.4 | 81 | 7 | 18 | 24 | 1986 | 15 | 5.2 | 4.7 | 1.02 |
| 1027 | Spruce | 1.4×1.4 | 81 | 7 | 18 | 24 | 1986 | 15 | 3.0 | 3.2 | 1.33 |
| 1028 | Spruce | 1.4×1.4 | 81 | 7 | 18 | 24 | 1986 | 15 | 5.7 | 5.6 | 1.03 |
| 1029 | Spruce | 1.4×1.4 | 81 | 9 | 24 | 24 | 1986 | 15 | 4.4 | 4.1 | 0.95 |
| 1030 | Spruce | 1.4×1.4 | 81 | 9 | 24 | 24 | 1986 | 15 | 5.4 | 4.6 | 0.95 |
| 1031 | Spruce | 1.4×1.4 | 81 | 9 | 24 | 24 | 1986 | 15 | 3.7 | 3.4 | 1.00 |
| 1032 | Spruce | 1.4×1.4 | 81 | 9 | 24 | 24 | 1986 | 15 | 6.3 | 5.8 | 0.95 |
| 448 | Pine | 2.2×1.5 | 160 | 6 | 12 | 16 | 1987 | 21 | 7.6 | 5.5 | 0.76 |
| 449 | Pine | 2.4×2.2 | 195 | 13 | 16 | 19 | 1987 | 21 | 4.3 | 3.3 | 0.84 |
| 450 | Pine | 2.2×2.2 | 257 | 18 | 19 | 20 | 1987 | 22 | 11.3 | 7.7 | 0.70 |
| 451 | Pine | 2.2×1.5 | 222 | 15 | 18 | 19 | 1987 | 22 | 7.0 | 4.6 | 0.70 |
| 452 | Pine | 2.2×2.2 | 185 | 11 | 16 | 18 | 1987 | 22 | 4.2 | 3.3 | 0.96 |
| 466 | Pine | 2.2×1.5 | 318 | 31 | 31 | 13 | 1988 | 21 | 9.7 | 7.3 | 0.77 |
| 467 | Pine | 2.2×1.5 | 318 | 31 | 31 | 13 | 1988 | 21 | 10.1 | 7.7 | 0.79 |
| 469 | Pine | 2.2×1.5 | 318 | 31 | 31 | 13 | 1988 | 21 | 10.0 | 7.5 | 0.77 |
| 470 | Pine | 2.2×1.5 | 318 | 31 | 31 | 13 | 1988 | 21 | 11.9 | 8.3 | 0.74 |
| 495 | Pine | 2.0×1.5 | 331 | 34 | 34 | 14 | 1990 | 22 | 7.1 | 4.4 | 0.65 |
| 496 | Pine | 2.2×2.2 | 331 | 35 | 34 | 14 | 1990 | 21 | 5.3 | 4.0 | 0.80 |
| 497 | Pine | 2.2×1.5 | 331 | 35 | 35 | 14 | 1990 | 22 | 8.5 | 6.5 | 0.80 |
| 498 | Pine | 2.2×1.5 | 331 | 34 | 34 | 14 | 1990 | 21 | 6.8 | 4.6 | 0.73 |
| 499 | Pine | 2.2×1.5 | 331 | 34 | 34 | 14 | 1990 | 21 | 5.6 | 4.5 | 0.87 |
| 506 | Pine | 2.0×1.0 | 378 | 64 | 64 | 17 | 1991 | 20 | 7.7 | 6.3 | 0.91 |
| 507 | Pine | 2.2×1.5 | 378 | 64 | 64 | 17 | 1991 | 20 | 6.9 | 5.6 | 0.86 |
| 508 | Pine | 2.2×1.5 | 378 | 64 | 64 | 18 | 1991 | 20 | 6.8 | 4.0 | 0.63 |
| 509 | Pine | 2.2×1.5 | 378 | 64 | 64 | 20 | 1991 | 20 | 9.1 | 7.2 | 0.82 |
| 510 | Pine | 2.2×1.5 | 378 | 64 | 64 | 22 | 1991 | 20 | 8.4 | 4.9 | 0.61 |
| 560 | Pine | 2.2×1.5 | 457 | 30 | 30 | 10 | 1993 | 20 | 5.8 | 3.7 | 0.68 |
| 561 | Pine | 2.3×1.5 | 457 | 30 | 30 | 13 | 1993 | 20 | 6.7 | 4.2 | 0.67 |
| 565 | Pine | 2.2×1.5 | 386 | 26 | 27 | 14 | 1994 | 20 | 4.6 | 3.5 | 0.82 |
| 566 | Pine | 2.2×1.5 | 386 | 26 | 27 | 14 | 1994 | 20 | 5.6 | 3.6 | 0.70 |
| 567 | Pine | 2.2×1.5 | 386 | 28 | 29 | 16 | 1994 | 20 | 5.4 | 3.4 | 0.69 |
| * PTWNT = Plus-trees with neighboring trees. ** NT = Neighboring trees. | |||||||||||
| Table 3. Slenderness models for Scots pine and Norway spruce. | |||||
| Variable | Scots pine | Norway spruce | |||
| Parameter estimates | Standard error | Parameter estimates | Standard error | ||
| Intercept | –1.9430 | 0.0855 | –2.7841 | 0.1558 | |
| SMS | 3.5859 | 0.2153 | 1.9061 | 0.2723 | |
| SMS2 | –1.5444 | 0.1382 | –0.4578 | 0.1562 | |
| h | 0.0037 | 0.0013 | –0.0513 | 0.0043 | |
| h–1 | - | - | 2.2541 | 0.1671 | |
| ln(h) | - | - | 0.8105 | 0.0592 | |
| Relh | –0.2682 | 0.0290 | –0.3186 | 0.0226 | |
| C | 0.0265 | 0.0116 | –0.0313 | 0.0090 | |
| M | - | - | 0.0206 | 0.0080 | |
| S | 0.0232 | 0.0078 | - | - | |
| RMSE | 0.15 | 0.13 | |||
| Adjusted R2 | 0.54 | 0.44 | |||
| SMS = Site mean slenderness. h = Tree height (m). C = Tree category, C = 1 if plus-tree, otherwise C = 0. M = 1 if the trees were located in the midst of Sweden, otherwise M = 0. S = 1 if the trees were located in the south of Sweden, otherwise S = 0. | |||||
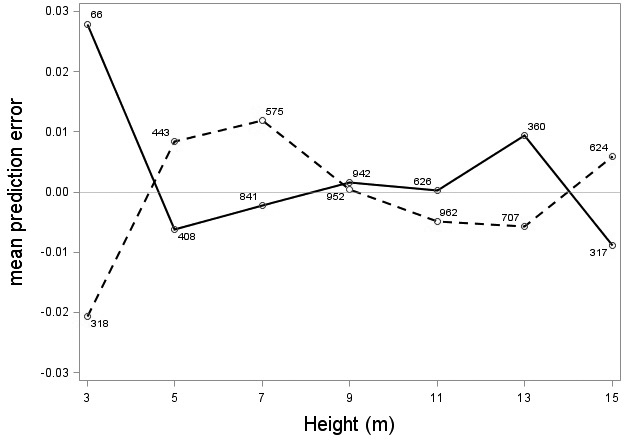
Fig. 1. Mean prediction error of logarithmic height-diameter ratio over height for Scots pine (solid line) and Norway spruce (dashed line). The numbers in the graph represent the number of trees in each class.
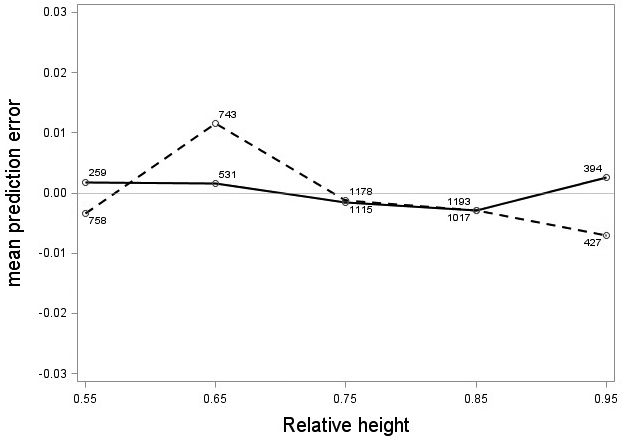
Fig. 2. Mean prediction error of logarithmic height-diameter ratio over relative height for Scots pine (solid line) and Norway spruce (dashed line). The numbers in the graph represent the number of trees in each class.
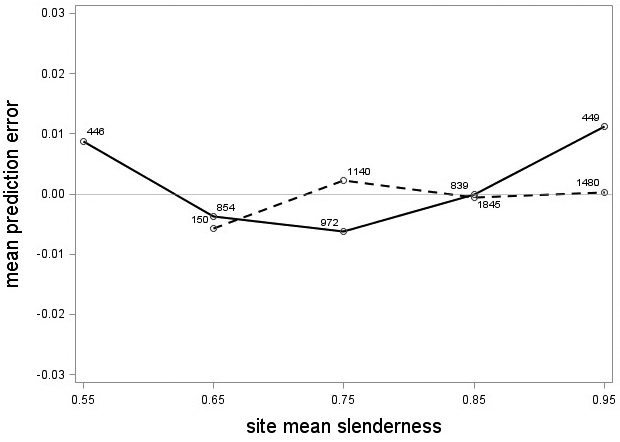
Fig. 3. Mean prediction error of logarithmic height-diameter ratio over site mean slenderness for Scots pine (solid line) and Norway spruce (dashed line). The numbers in the graph represent the number of trees in each class.
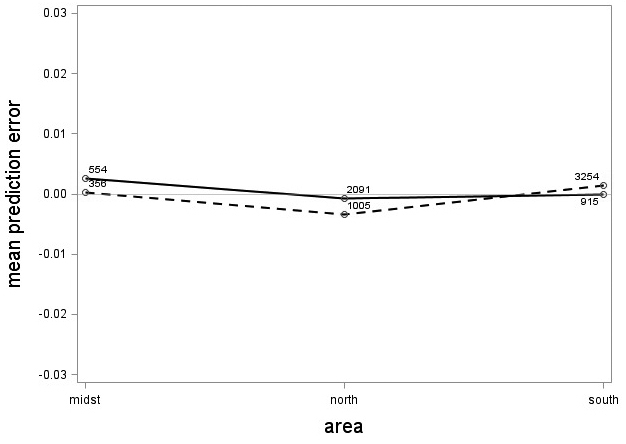
Fig. 4. Mean prediction error of logarithmic height-diameter ratio over region in Sweden for Scots pine (solid line) and Norway spruce (dashed line). The numbers in the graph represent the number of trees in each class.
| Table 4. Narrow sense heritabilities and associated standard errors for indicated traits of Scots pine and Norway spruce. | ||||
| Scots pine | Norway spruce | |||
| Heritability | Standard error | Heritability | Standard error | |
| height | 0.35 | 0.02 | 0.31 | 0.03 |
| diameter | 0.24 | 0.01 | 0.37 | 0.04 |
| height-diameter ratio | 0.11 | 0.01 | 0.19 | 0.02 |
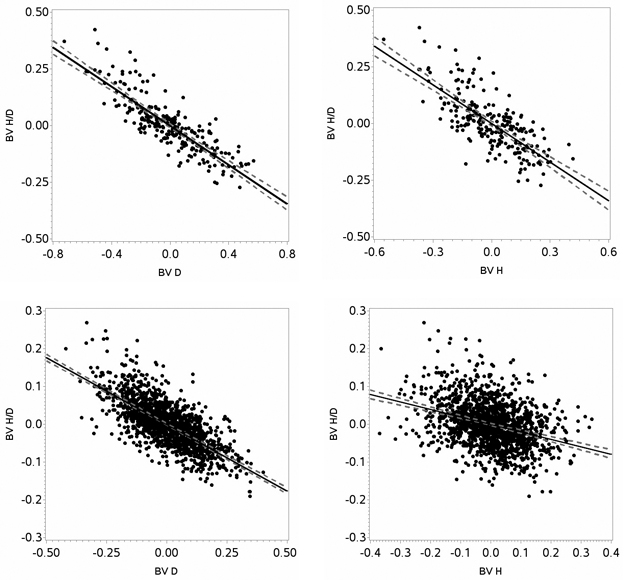
Fig. 5. Estimated breeding values (BV) for height (H), diameter (D) and height-diameter ratio (H/D) for Norway spruce (upper panels) and Scots pine (lower panels) including regression lines (black lines) with confidence intervals (grey dotted lines).