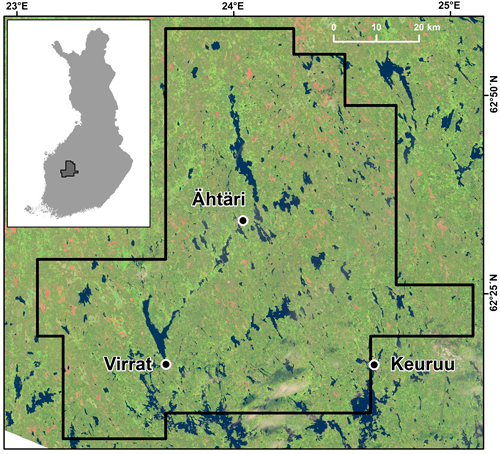
Fig. 1. Study area in Finland visualized on top of the Landsat 8 image (2014) used in the study.
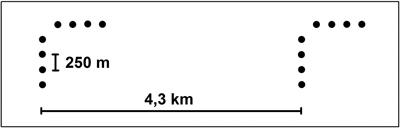
Fig. 2. Field sampling design used in the study.
| Table 1. Field-measured mean, standard deviation (SD) and maximum (Max) values of tree height (H) and diameter at breast height (D) as well as volume metrics including pine, spruce and broadleaved species. | ||||||
| H (m) | D (cm) | Vol tot (m3 ha–1) | Vol pine (m3 ha–1) | Vol spruce (m3 ha–1) | Vol Broadl. (m3 ha–1) | |
| Mean | 12.7 | 15.6 | 120.9 | 73.3 | 28.5 | 19.1 |
| SD | 5.83 | 7.54 | 95.6 | 70.8 | 63.4 | 34.3 |
| Max | 28.1 | 43.8 | 867.3 | 519.9 | 461.3 | 411.9 |
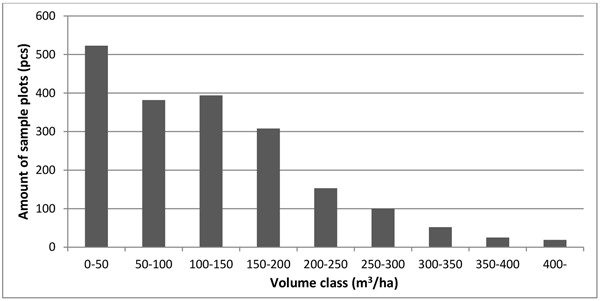
Fig. 3. Distribution of total tree volume in the sample plots.
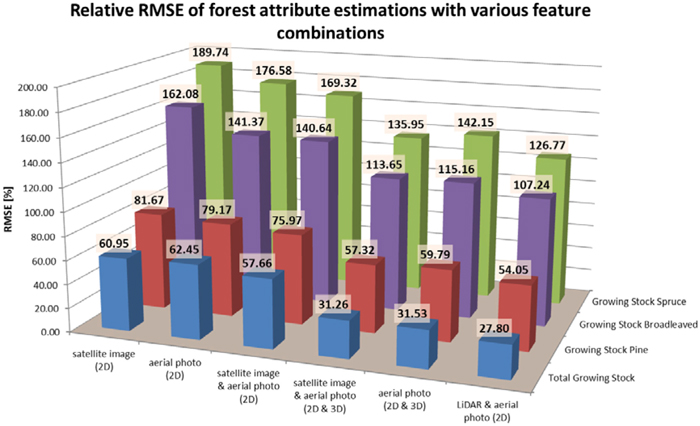
Fig. 4. Relative RMSEs of volume (total, pine, broadleaved trees and spruce) estimates.
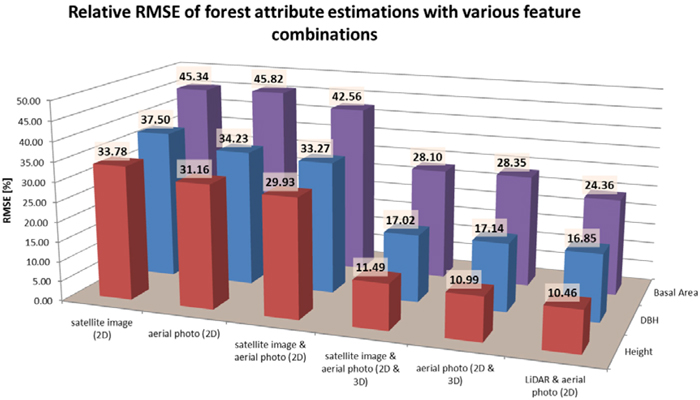
Fig. 5. Relative RMSEs of height, DBH and basal area estimates.
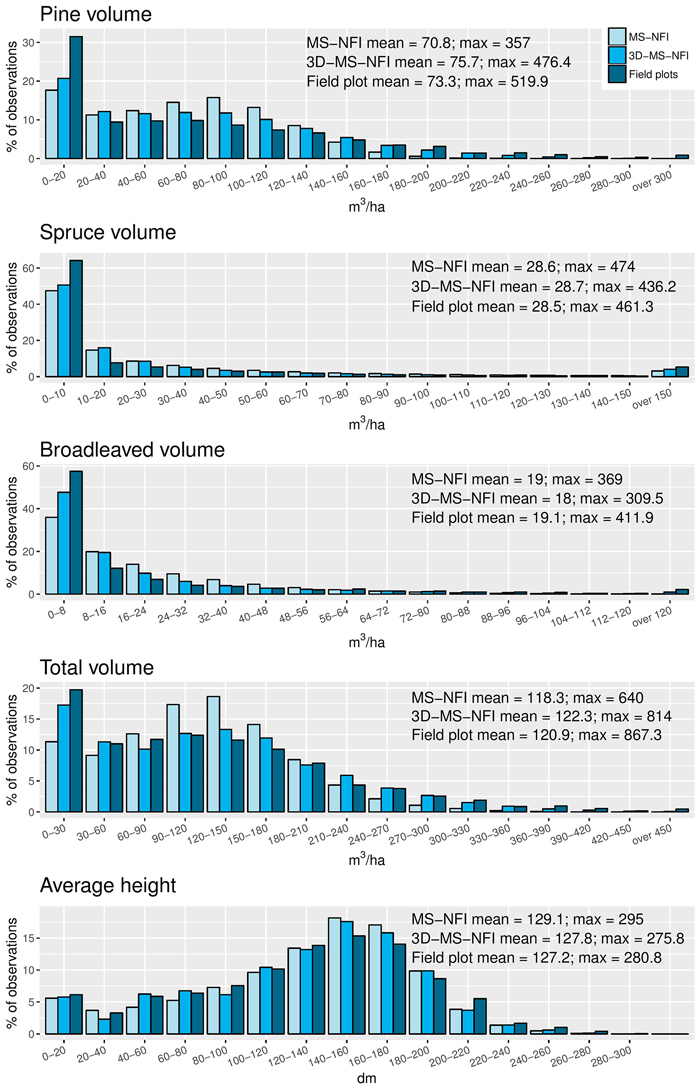
Fig. 6. Histograms of the different variables from operational MS-NFI, 3D-MS-NFI results (satellite image and aerial photos 2D + 3D) of this study, and sample plots. Features selected for this comparison are total volumes of growing stock for pine, spruce and broadleaved trees, and average height of the trees.
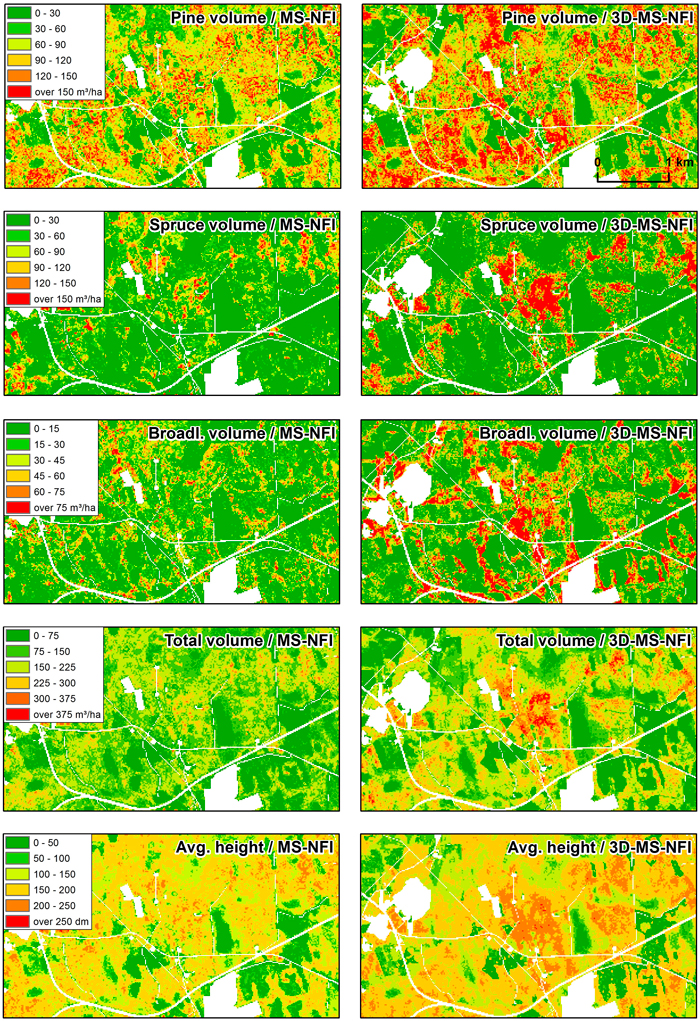
Fig. 7. Visualization of the different variables based on operational MS-NFI (left) and 3D-MS-NFI results of this study (right) related to growing stock volumes and average height.
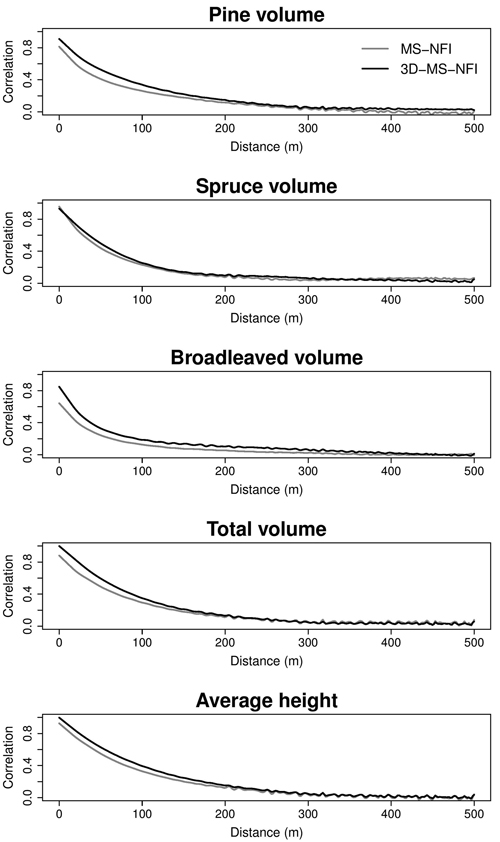
Fig. 8. Correlograms (i.e. correlation as a function of distance between pixels) of the growing stock volumes (pine, spruce, broadleaved, total) and average height.
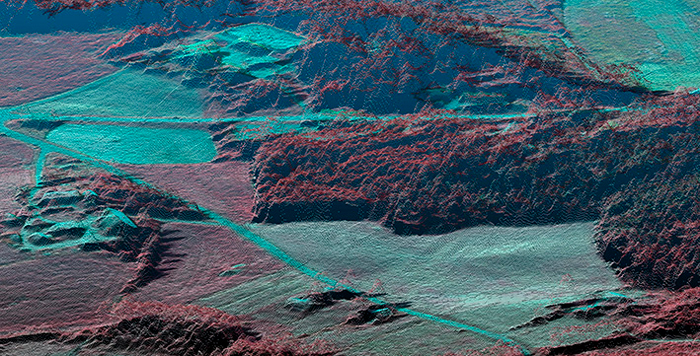
Fig. 9. An illustration of the photogrammetric point cloud.
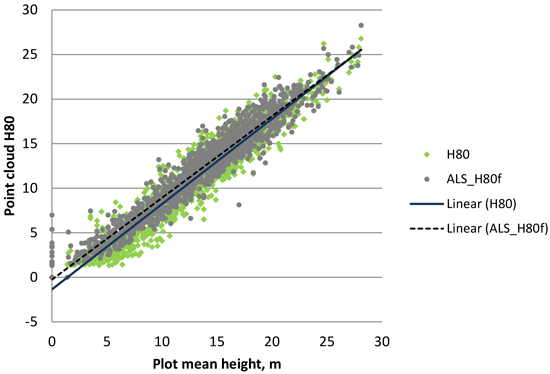
Fig. 10. Scatter plot describing the relation of H80 feature of 3D cloud points (first points only in ALS data) vs. measured value (H80 was selected because it usually corresponds well to the mean height of a plot). Linear trendline of ALS data shows R2 = 0.9405; with photogrammetric data R2 = 0.9203.