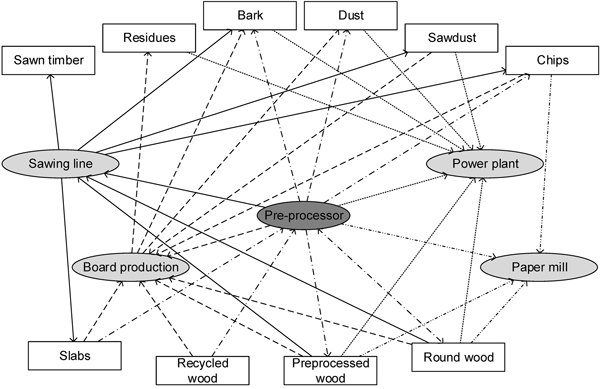
Fig. 1. Schematic log yard diagram of a super wood factory where a sawmill is combined with board production, paper mill and a power plant. The pre-processor is an additional possible step before production which can be debarking, bucking, chipping or particle preparation.
| Table 1. Papers on log yard logistics with different subject areas and solution methods. | ||
| Authors | Subject area | Used method |
| Baesler et al. (2002) | Loader scheduling | Simulation optimisation; Genetic algorithm heuristic |
| Beaudoin et al. (2012) | Material flow analysis; Loader scheduling and duty assignment | Discrete event simulation |
| Rathke et al. (2013) | Facility layout planning; Storage assignment | Mixed integer programming model; Heuristic |
| Rahman et al. (2014b) | Storage assignment; Seasonality | Discrete event simulation; Metaheuristic |
| Robichaud et al. (2014) | Material flow analysis; Facility layout planning; Loader scheduling; Seasonality | Discrete event simulation |
| Silver and Zufferey (2005) | Inventory management; Seasonality | Heuristic; Tabu Search; Simulation |
| Shaik et al. (2012) | Loader scheduling | Multi-agent based simulation |
| Yujie and Fang (2009) | Material flow analysis; Facility layout planning | Relationship chart; Correlation and closeness table |
| Table 2. Basic elements: data, storage, transport (vehicles and loaders). | ||
| Data | • Volume | • Weight |
| • Yard dimensions | • Yard layout | |
| • Distances | • Location of fixed items | |
| • Seasonality in data | • Boundary conditions | |
| • Number of assortments | ||
| Storage | • Needed space | • Geometries |
| • Storage requirements | • Driveways | |
| • Maximum storage heights | ||
| Vehicles | • Vehicle types | • Duties |
| • Transportation fleet variety | • Capacity per trip | |
| • Multimodality | • Shift models | |
| • Schedule | • Non-profitable duties | |
| • Loading and unloading | • Technical details | |
| • Costs | ||
| Table 3. Planning problems. | ||
| Problems | Applications | |
| Tactical structural planning | • Material flow overview • Facility layout planning • Storage assignment | • New facilities planning ∘ Placement of grading and measuring stations ∘ Location of machines • Evaluation of log yards ∘ In/dependent storage assignment |
| Operational planning | • Material movement • Empty trips • Seasonality and raw material supply | • Operations and IT support ∘ IT-systems integration • Loader control system ∘ Loaded and empty runs ∘ Routing and dispatch of loaders • Frequency and re-planning ∘ One time setup planning ∘ Automatic re-planning for seasonality |
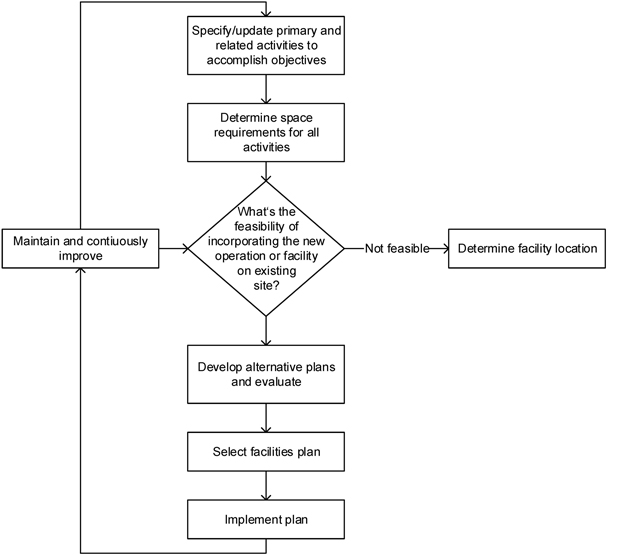
Fig. 2. Continuous improvement facilities planning cycle, Tompkins et al. (2010).
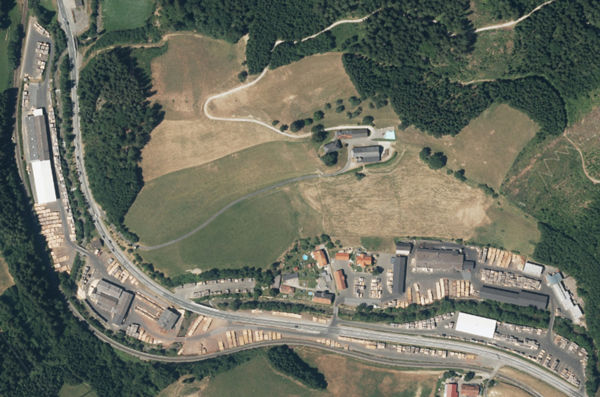
Fig. 3. Layout of the sawmill bisected by a main road, © GIS Steiermark, 2017, www.gis.steiermark.at.
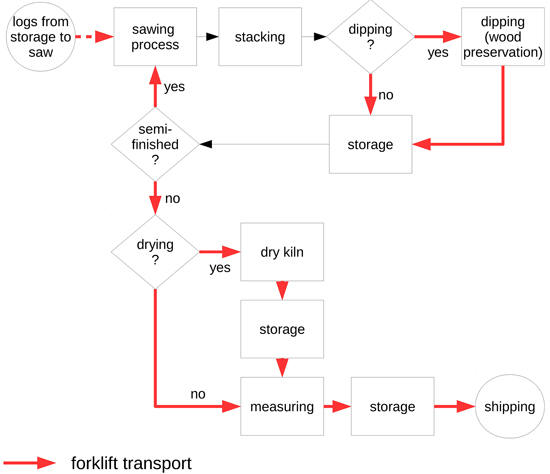
Fig. 4. Forklift resource scheduling logic during the production process.
| Table 4. Potential savings of improved storage assignment and centrally located unloading station in comparison to the existing layout. | ||||
| Original layout | Central unloading | |||
| Distance | Crossings | Distance | Crossings | |
| Status quo | 27 705 km | 28 896 | 27 984 km | 30 090 |
| New assignment | 25 339 km | 24 207 | 25 706 km | 25 401 |
| Possible improvement | 2366 km | 4689 | 2277 km | 4689 |
| Savings | 8.5% | 16.2% | 8.1% | 15.6% |
| Savings compared to original layout | 7.2% | 12.1% | ||
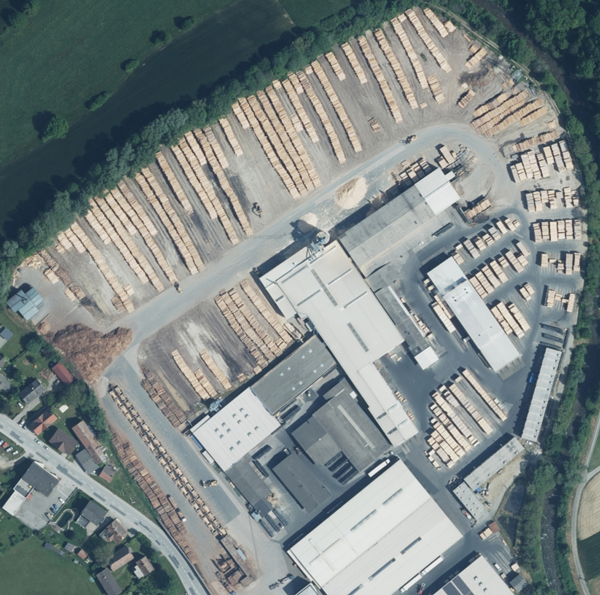
Fig. 5. Log yard layout of the sawmill investigated with a sorting line on the bottom left corner with 40 ejection boxes, storage areas located at the upper left corner alongside a tree line where the debarked logs are stored and the material charge on the top right corner of picture, © GIS Steiermark, 2017, www.gis.steiermark.at.
| Table 5. Saving in operating hours for different grapple utilization and scenarios for all vehicles on the log yard. | ||||||
| Grapple utilization | 56% | 60% | 70% | 80% | 90% | 100% |
| Status quo | 0% | 4% | 11% | 16% | 20% | 24% |
| Optimised | 5% | 8% | 14% | 18% | 22% | 25% |
| Relocation of material charge | 7% | 10% | 18% | 23% | 27% | 31% |
| Relocation and optimised | 12% | 15% | 22% | 26% | 30% | 33% |
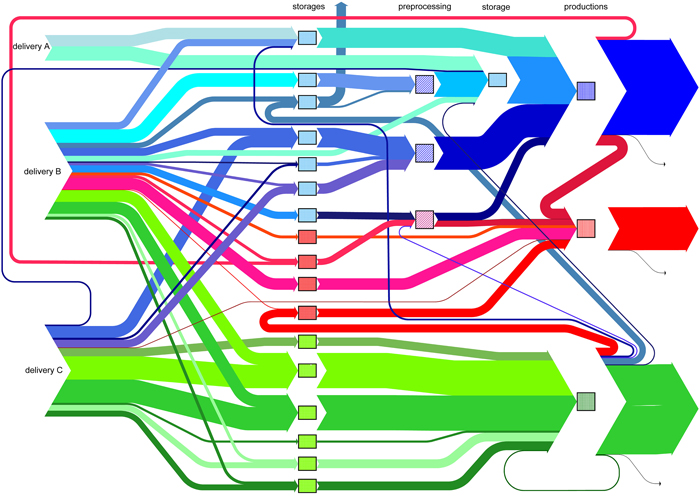
Fig. 6. Internal material flow within the log yard of a panel producer where the material is delivered at three different locations and distributed to different storage areas on the log yard depending on the assortment and geometry of the raw material, with pre-processing if needed, waste management, different production sites, indicated with different colours and discarded material. View larger in new window/tab.
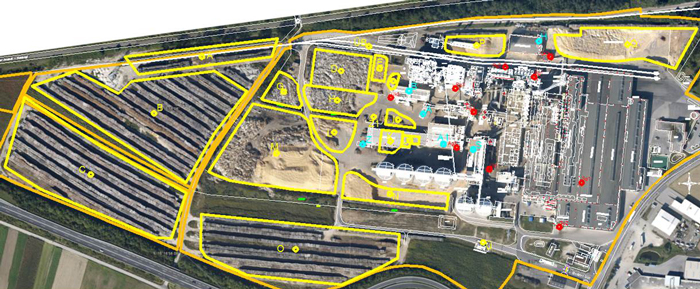
Fig. 7. Layout and storage assignment of sample chip board industry with storage areas indicated in yellow for different geometries of raw material, locations of material charges in turquoise and locations where recycling material accrues in red. View larger in new window/tab.