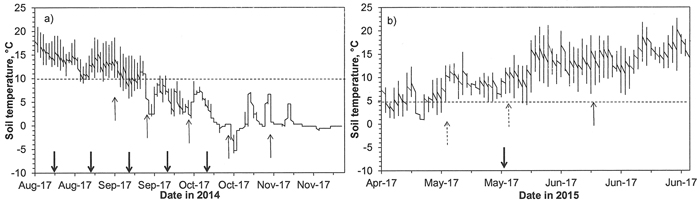
Fig. 1. Soil temperature measured at the depth of 12 cm (the bottom of a peat plug in a seedling planted to the depth of 6 cm) in a mound in a forest site a) just after planting in 2014, and b) in spring 2015. The thick arrows indicate the planting dates, thin arrows the dates when root growth three weeks after planting was assessed, and arrows with broken lines the dates when the initiation of root growth was measured in spring 2015. Broken horizontal lines are for +10 °C in a) and for +5 °C in b).
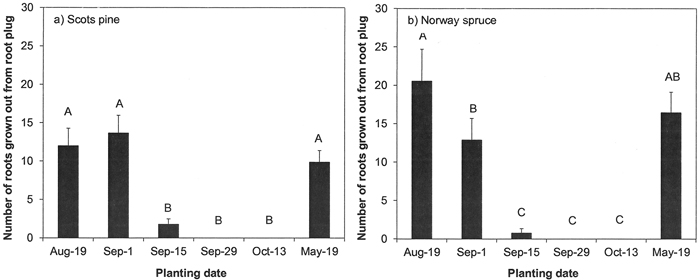
Fig. 2. Root growth of a) Scots pine and b) Norway spruce seedlings immediately after planting. Root growth was assessed as the number of roots grown out from a peat plug during a three-week period after planting in the nursery field. Vertical bars indicate standard errors of means (N = 9). Letters above bars indicate statistically significant (p < 0.05) differences among the planting dates.
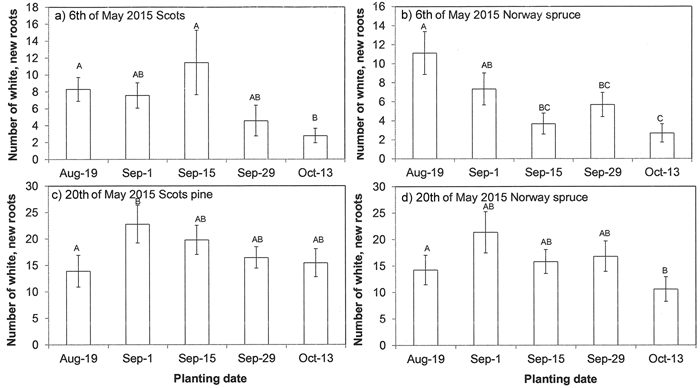
Fig. 3. Root growth of a, c) Scots pine seedlings and b, d) Norway spruce in the following spring after autumn plantings. Root growth was assessed as the number of new white roots grown out from a peat plug until a, b) 6th of May and c, d) 20th of May 2015 in the nursery field. Vertical bars indicate standard errors of means (N = 9). Letters above bars indicate statistically significant (p < 0.05) differences among planting dates.
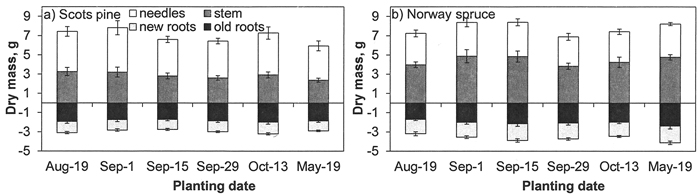
Fig. 4. Dry mass of needles, stems and new (roots grown out from peat plugs after planting) and old (roots inside a pleat plug) roots in a) Scots pine and b) Norway spruce seedlings in the nursery field at the end of first growing season. Vertical bars indicate standard errors of means (N = 9).
| Table 1. Repeated (measuring year Y) mixed model analysis of variance for planting date (D) on the shoot height and diameter of Norway spruce and Scots pine seedlings planted in the nursery field. The variance of random effects of each planting year and block are also presented. | ||||||||
| Source | Spruce | Pine | ||||||
| Height | Diameter | Height | Diameter | |||||
| Fixed effects | F | p-value | F | p-value | F | p-value | F | p-value |
| Intercept | 12 978 | <0.001 | 13 958 | <0.001 | 12 335 | 0.004 | 17 800 | <0.001 |
| Planting date (D) | 0.5 | 0.796 | 3.0 | 0.012 | 2.5 | . | 10.8 | <0.001 |
| Year (Y) | 1107 | <0.001 | 2120 | <0.001 | 2823 | <0.001 | 3526 | <0.001 |
| Y × D | 1.7 | 0.079 | 1.7 | 0.082 | 3.1 | 0.067 | 8.5 | <0.001 |
| Variance estimates for repeated planting year effect and block effect | ||||||||
| At planting | 3.49 (0.94) | 0.06 (0.01) | 3.3 (45) | 0.01 (0.01) | ||||
| First year | 19.13 (2.30) | 0.54 (0.06) | 7.3 (7.9) | 0.7 (0.1) | ||||
| Second year | 53.05 (5.26) | 2.98 (0.27) | 34.8 (7.6) | 4.0 (1.1) | ||||
| Block effect | 7.26 (<0.01) | 0.09 (<0.01) | 8.24 (<0.01) | 0.07 (<0.01) | ||||
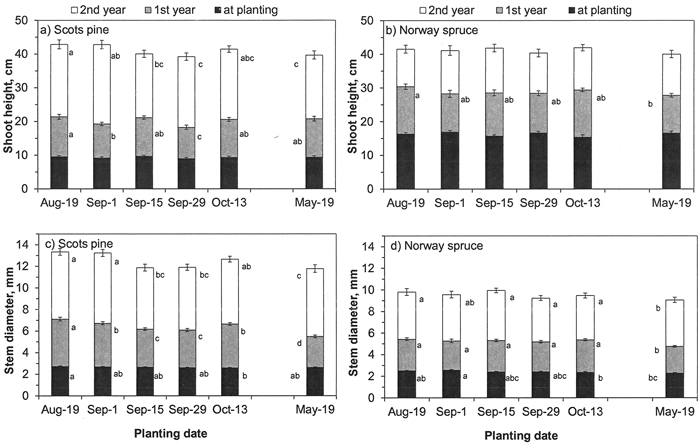
Fig. 5. a, b) Shoot height and c, d) stem diameter of a, c) Scots pine and b, d) Norway spruce seedlings planted in the nursery field in Suonenjoki biweekly in autumn 2014 and once in spring 2015. Height and diameters were measured at planting and at the end of two growing seasons after planting. Vertical bars indicate the standard errors of means and different letters indicate statistically significant differences (p < 0.05) among planting dates within a measuring year (N = 5 seedlings in 9 blocks).
| Table 2. Repeated (measuring year Y) mixed model analysis of variance for planting date (D) on the shoot height and diameter of Norway spruce and Scots pine seedlings planted at the forest site. Variances of random effects of each planting year and block are also presented. | ||||||||
| Source | Spruce | Pine | ||||||
| Height | Diameter | Height | Diameter | |||||
| Fixed effects | F | p-value | F | p-value | F | p-value | F | p-value |
| Intercept | 8489 | <0.001 | 12 621 | <0.001 | 3159 | <0.001 | 4806 | <0.001 |
| Planting date (D) | 3.3 | 0.007 | 4.9 | <0.001 | 0.6 | 0.686 | 1.7 | 0.124 |
| Year (Y) | 1107 | <0.001 | 2424 | <0.001 | 902 | <0.001 | 931 | <0.001 |
| Y × D | 6.5 | <0.001 | 7.1 | <0.001 | 3.0 | 0.002 | 4.6 | <0.001 |
| Variance estimates for repeated planting year effect and block effect | ||||||||
| At planting | 6.46 (0.92) | 0.01 (0.01) | 4.9 (0.4) | 0.1 (0.01) | ||||
| First year | 20.44 (2.13) | 0.63 (0.06) | 31.2 (2.8) | 1.0 (0.1) | ||||
| Second year | 102.75 (9.31) | 2.27 (0.18) | 266.2 (23.7) | 11.9 (1.1) | ||||
| Block effect | 4.05 (<0.01) | 0.11 (<0.01) | 0 | 0.008 | ||||
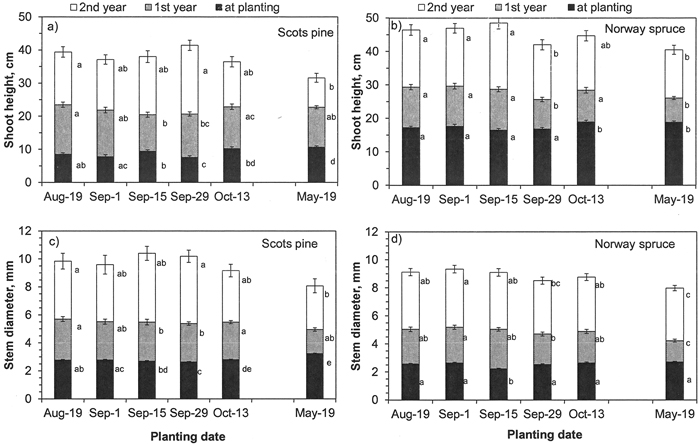
Fig. 6. a-b) Shoot height and c-d) stem diameter of a, d) Scots pine and b, d) Norway spruce seedlings planted in the forest site biweekly in autumn 2014 and once in spring 2015 and measured at planting and at the end of two growing seasons after planting. Vertical bars indicate the standard errors of means and different letters indicate statistically significant differences (p < 0.05) among planting dates within a measuring year (N = 43 for Scots pine and N = 45 for Norway spruce).